The Q2 2026 earnings season begins today, with major US banks including JPMorgan, Bank of America, Citigroup, and Wells Fargo traditionally leading the June quarter reporting cycle on July 14.
The macro backdrop remains highly supportive. The estimated year over year earnings growth rate for the S&P 500 in Q2 2026 is 23.3%, up from 18.8% three months ago. If confirmed, this would mark the second consecutive quarter of earnings growth above 20%, well above the five year average of 16.4% and the ten year average of 10.3%. This reflects strong underlying fundamentals supporting the current market rally rather than simple valuation expansion.
Financial stocks have also been the best performing sector over the past month, with the XLF ETF gaining 5.49% since June 13. Interest rates continue to support the sector. As of July 10, the 10 year Treasury yield stands at approximately 4.62%, compared with around 4.28% for the 2 year Treasury yield, leaving the 2s10s spread positively sloped at about 34 basis points. Although the yield curve has flattened throughout 2026 after reaching nearly 73 basis points at the start of the year, a positive slope remains supportive for bank profitability by maintaining a healthy gap between long term lending rates and short term funding costs, supporting net interest margins as banks enter earnings season.
Bank of America is among the best positioned large cap banks to benefit from the current environment. Its diversified business spans consumer banking, global markets, investment banking, and wealth management through Merrill, providing multiple and relatively uncorrelated revenue streams.
The bank has raised its full year net interest income growth guidance to 6% to 8% and reaffirmed its expectation of more than 200 basis points of positive operating leverage for 2026. In the first quarter, return on tangible common equity reached 16%, within its medium term target range of 16% to 18%.
Ahead of today’s earnings release, Wall Street expects earnings per share of approximately $1.12, representing about 25.5% year over year growth, while revenue is forecast at roughly $30.8 billion. Investors will closely monitor net interest income, capital markets and trading revenue, and credit quality metrics.
Technical Analysis
Bank of America shares have gained 29% since the March 19 low of $45.87 and are up 21% since May 15, when the latest bullish leg began. The stock is currently trading near $59.50, just below its all time high of $60.82.
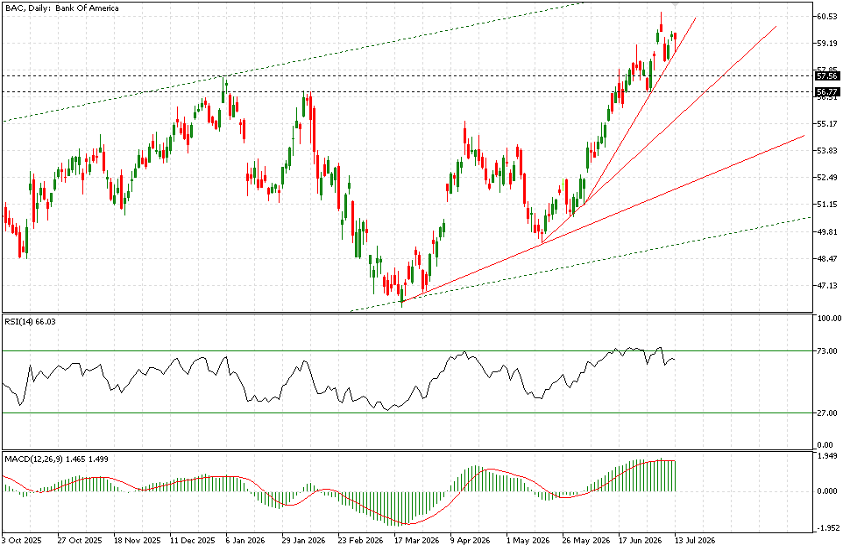
The green dashed lines highlight the ascending channel that has guided price action since November 2023. The channel remains well defined and has been tested at least three times along its upper boundary, which is currently located just below the $62 level. This represents the next upside target if the rally continues.
Using the March 19 and May 15 lows as reference points, several trendlines with varying slopes continue to support the advance. Yesterday’s session successfully retested the steepest trendline near $58.75. While the broader uptrend remains intact, the pace of the rally may begin to moderate, allowing the stock to consolidate along less aggressive trendlines. Such a move could see the price revisit the previous all time high region between $56.75 and $57.50 before extending higher.
Recent candlestick activity also suggests the market is approaching a potential short term inflection point. Several sessions over the past month have produced long wicks and spinning tops, indicating hesitation among buyers. However, strong bullish candles, including those formed yesterday and on July 2, suggest buying momentum remains strong.
The options market is currently pricing in an implied move of approximately 2.78% following the earnings release. A decline of that magnitude would bring Bank of America close to support near $57.55, while a move of similar size to the upside would be sufficient to push the stock to new all time highs.