The Nasdaq has experienced heightened volatility in recent weeks. Since June 1, across 27 trading sessions, the index has recorded intraday moves exceeding 1% on 20 occasions, at least 1.5% on 14 occasions, and more than 2% on seven occasions. Over this period, the average daily move has been 1.47%, compared with 0.90% over the previous 12 months (as of July 14, 2025).
We previously highlighted the ongoing sector rotation between defensive and higher growth areas of the market, with Industrials, Financials, and Healthcare leading gains over the past month. An equally important development within the Nasdaq is the rotation occurring inside the technology sector, particularly between hyperscalers, including several former Magnificent Seven stocks, and semiconductor manufacturers. Leadership has shifted repeatedly between these groups, amplifying price swings even among the largest-cap companies.
Last Friday, for example, Meta and NVIDIA each gained more than 4%, while Marvell fell 3.07% and Intel declined 2.40%. Despite these significant individual moves, the Nasdaq closed the session up just 0.33%.
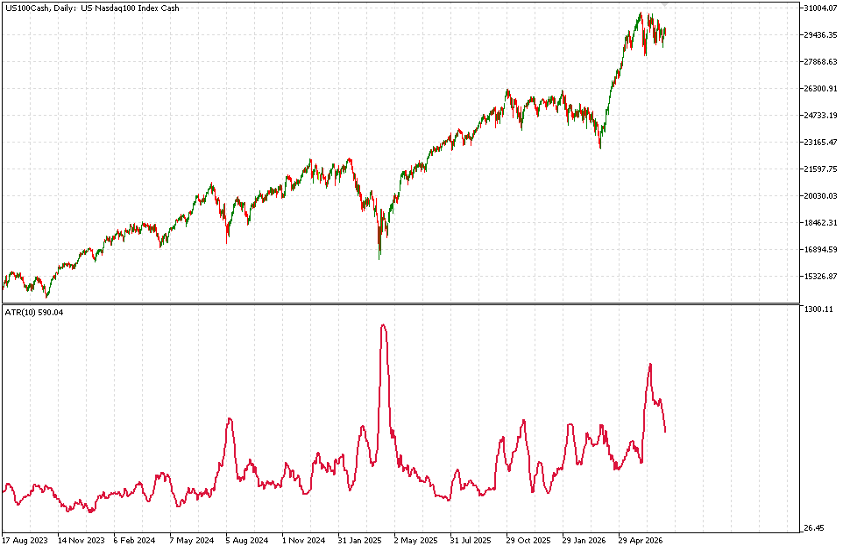
The recent rise in volatility is also reflected in the Average True Range (ATR). The Nasdaq’s 10 day daily ATR currently stands at 589 points, equivalent to roughly 2% of the index’s value, representing a historically elevated reading.
Historically, ATR levels this high have typically appeared near the end of market corrections, as seen in August 2024 and April 2025. This time, however, they are emerging while the index is trading near the highs of a strong bull market.
Similar ATR readings were observed between October 2025 and March 2026 before the last meaningful correction. The key difference is that ATR was then declining from nearly 1,000 points, while the 600 point level represented the peak reached during that period.
Overall, the Nasdaq continues to trend higher, but the advance is accompanied by increasing volatility.
Technical Analysis
Focusing on the 4 hour chart, a flag or triangle formation has been developing since the index broke above 28,000 following May 5. Notably, the Nasdaq has remained above this level since the breakout, reinforcing its importance as a major support zone.
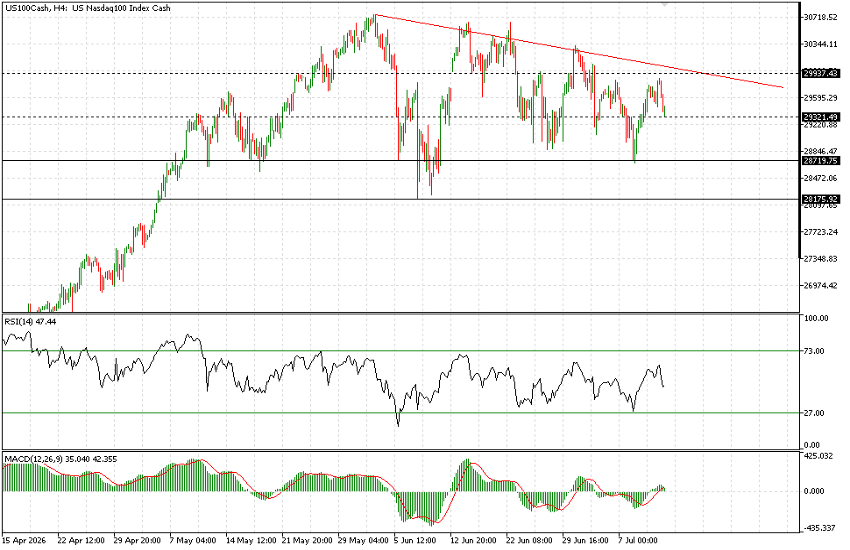
The first key support lies at 28,700, a level that has held repeatedly over the past two months and remains one of the most important areas on the chart. Below that, 28,150, tested twice in early June, represents the critical last line of support.
On the upside, traders should monitor resistance around 29,300, followed by 29,950. The latter is particularly significant as it aligns with the descending trendline originating on June 6, which has already been tested four times, making it a well established resistance level.
These two levels, 28,150 and 29,950, will be critical in the coming sessions. A decisive break below 28,150 could trigger a meaningful increase in volatility, while a breakout above 29,950 may open the path toward another test of the all time highs above 30,750.
Momentum indicators on the 4 hour chart remain broadly neutral with a slight bearish bias, as the RSI sits around 45. On the daily timeframe, conditions appear somewhat weaker, with the MACD having moved below the zero line.
Overall, caution remains warranted while the Nasdaq trades near record highs. Closely monitoring these key technical levels will be essential in the sessions ahead.