In yesterday’s post, we examined the state of the U.S. consumer after highlighting that the three worst performers over the last three months within the DJ30 all belonged to the Consumer / Consumer Staples sector. We observed that the main macro indicators — the University of Michigan Consumer Sentiment and the Conference Board Consumer Confidence indices — have both been deteriorating for some time, despite divergences between the two series. The former remains near historical lows, while the latter is less negative.
This deterioration in sentiment has not yet translated into weakness in hard data such as Retail Sales, which continue to remain positive in the United States. Nevertheless, this has not prevented shares of McDonald’s, Home Depot, and Nike from significantly underperforming the broader market. After examining McDonald’s yesterday, we now turn to the other two companies.
Technical Analysis
Home Depot (HD) is the world’s largest home-improvement retailer, selling tools, building materials, appliances, and home décor to both DIY consumers and professional contractors across roughly 2,300 stores in North America. The rise in mortgage rates is clearly affecting the stock price. The company’s CFO recently noted that the core homeowner remains resilient, but “up to a certain point.”
Operationally, the latest quarter remained solid. Q1 FY2026 sales reached $41.8 billion, up 4.8% year-on-year, while net earnings came in at $3.3 billion. Earnings per share, however, edged slightly lower compared with the previous year.
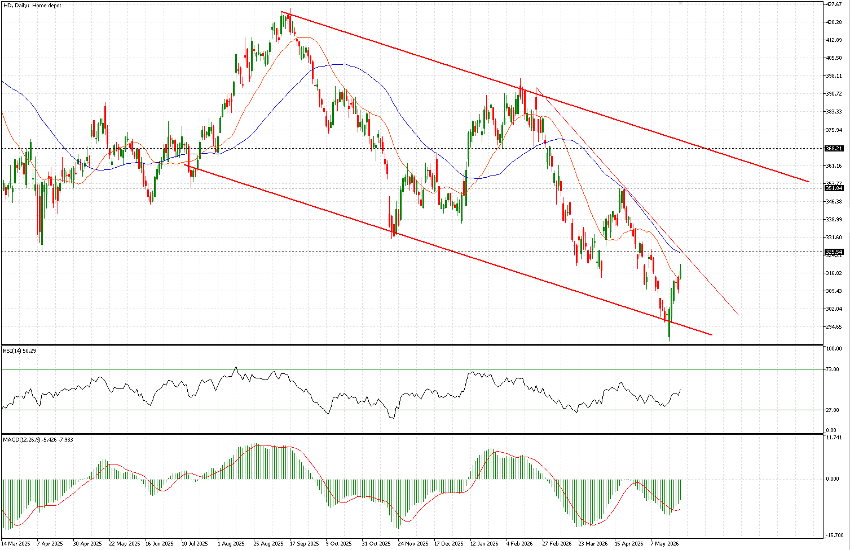
The stock has been in a clear downtrend since at least August 2025, when it reached highs near $425. As of yesterday, it was trading around $318. A well-defined descending channel remains in place, characterised by at least three major waves, including two strong bearish impulses.
After touching a low near $288 on May 19, the stock has attempted to recover. However, a clearly bearish internal trendline within the broader channel now converges near current levels, making the $325 area a key test. The 50-day moving average also passes through this zone.
Since yesterday, price has moved above the 21-day moving average and momentum indicators have improved, with the RSI reaching 50.29, slightly positive. A confirmed breakout above $325 would represent a constructive technical signal and could open the path toward the upper boundary of the channel, potentially near $350. This area also represents major resistance, while higher resistance is located near $368.
Nike (NKE) requires little introduction. It remains the world’s largest athletic footwear and apparel company, selling sneakers, sportswear, and equipment through wholesale retailers, direct-to-consumer stores, and digital channels. Its brand recognition and global reach remain unmatched.
At present, however, the company remains in the middle of a significant turnaround process as it attempts to rebalance its distribution model after over-indexing on direct sales, which negatively affected wholesale relationships. In the latest quarter (Q3 FY2026), total revenue reached $11.3 billion, flat year-on-year, while net income declined 35% to $520 million, highlighting that the recovery process remains incomplete.
The stock has been in a prolonged decline since late 2021, when it traded near $166. Yesterday’s close was around $45, illustrating how excessive long-term upside in individual equities can eventually reverse sharply. Current price levels are now close to the lows seen during 2016–2017, with the $43–45 area previously acting as a major support zone.
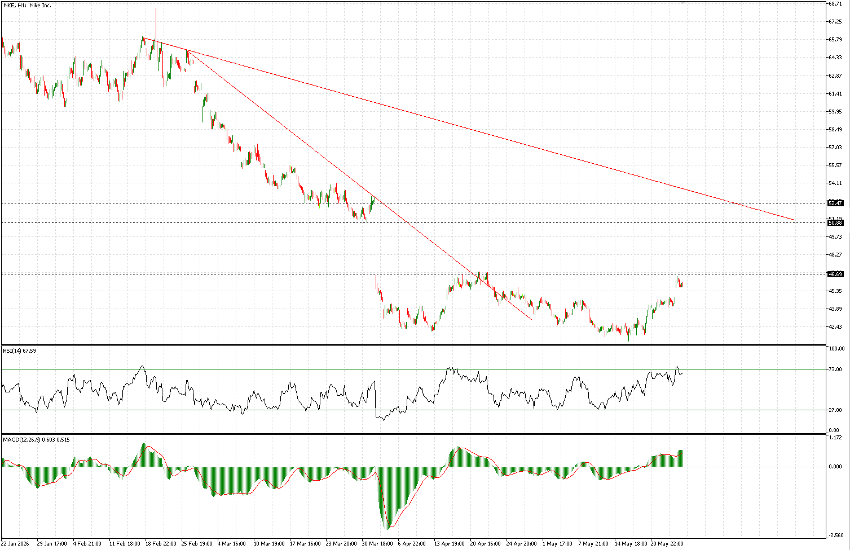
Here, we focus on the 1-hour chart, where the latest bearish impulse began around mid-February near the $65 level. Two descending trendlines remain visible, alongside the gap-down structure formed at the beginning of April.
The steeper downtrend has now been broken, leading to a period of sideways consolidation. As a result, there may be room for a test of the less aggressive descending trendline which, if reached, would likely intersect between $50 and $52 — close to the opening level of the April gap.
Before that, however, the market will need to break above the $46.70 level tested yesterday. A clear breakout above this area could trigger a faster rally toward the short-term targets previously mentioned. This is particularly relevant because the $43–45 range continues to act as a long-term support zone and may continue to hold over the near term.