After testing the 28.75 area several times toward the end of March, and after briefly pushing above 30 beforehand, the VIX has gradually drifted lower once again, following the typical post-spike pattern often seen in volatility markets. Green candles have been rare over the last two months and, when they did appear, they often came in the form of spinning tops with long upper wicks, signalling that intraday rallies struggled to hold.
The May 12 spike should not be overinterpreted. It reflected the rollover into the new futures contract, as the VIX expires monthly on the third Tuesday of each month. In this case, the move was linked to the current June contract which, due to the curve generally being in contango, almost always causes prices to gap higher.
This dynamic frequently repeats within the classic “VIX down, equities up” relationship, allowing the implied volatility gauge to bounce from technically depressed levels before resuming its slow grind lower.
The index is now approaching levels that deserve attention, with 18 days still remaining before the next rollover.
Technical Analysis
The 17–17.80 region represents the first support area, while slightly below, the 15.25–16 zone is another range where the VIX has historically tended to slow down, hesitate, and occasionally reverse direction. A final and more important area sits lower between 13.40 and 13.85, although it has not been revisited consistently since the 2023–2024 period.
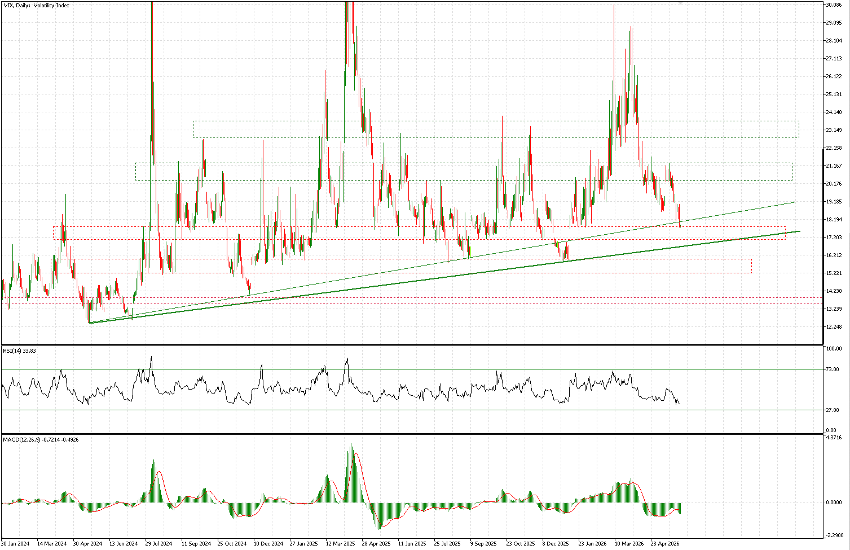
What currently stands out are the trendline scenarios that can be drawn from the last time this lower area was tested in 2024. Those trendlines now intersect around 18.06, roughly the levels touched yesterday, and around 16.70. Even in the latter case, the distance from the current price of 17.87 is relatively small. If the low-volatility environment persists, that level could be reached fairly quickly, potentially within the 18 days before the next rollover.
This suggests that the VIX may eventually stage a more meaningful rebound, rather than only the mechanical bounce typically generated by the rollover from one contract into the next. It is therefore worth monitoring, if not actively trading, given the deeply interconnected relationship between the VIX and the S&P 500, and the broader significance of volatility dynamics for equity markets.