Gold was trading near $4,150 in the previous outlook, where the technical picture pointed to increasing downside risks and the potential for a move back toward the $3,000 area. Selling pressure subsequently intensified, pushing prices as low as $3,942 before the metal established a base around $3,960 between June 24 and July 1.
Over the past few sessions, gold has regained momentum. At the time of writing, it is trading at $4,123, although it remains down 0.98% for the session.
Several inflation releases came in slightly better than expected, particularly in the Eurozone and Australia. However, the more significant development has been the shift in communication by major global central banks.
The move away from forward guidance, strongly championed by the Fed’s new Chair, Walsh, marks a significant change from the policy approach of the past 15 years. The shift was reinforced last week by major central banks, including the ECB, BoE, and BoC, during the central banking forum in Sintra, Portugal.
At the same event, policymakers reiterated that inflation remains too high and must be brought under control despite the sharp decline in oil prices. This message was already evident at the latest Fed meeting and is expected to receive further attention when the FOMC minutes are released on Wednesday.
Under these conditions, US Treasury yields and long-term inflation expectations might have been expected to rise together. Instead, nominal yields remained broadly stable while inflation expectations declined.
The US 10-year Treasury yield is only around 4 basis points higher than it was on June 17, while the 2-year yield is 3 basis points lower at 4.135%. More importantly, the 10-year breakeven inflation rate has fallen from 2.50% in mid-May to 2.24%.
As a result, long-term real yields, arguably the macroeconomic variable with the strongest inverse correlation to gold prices, have continued to trend higher and now stand near 2.26%, close to the upper end of their three-year range. This remains an unfavorable backdrop for gold.
Technical Analysis
Despite the recent recovery, the rebound still appears to be a technical bounce rather than the start of a new bullish trend.
On the four-hour chart, the RSI has displayed a bullish divergence since June 10, when gold was trading near the key $4,360 pivot. That divergence helped establish the consolidation around $3,960 during the second half of June, following an extended period of oversold conditions.
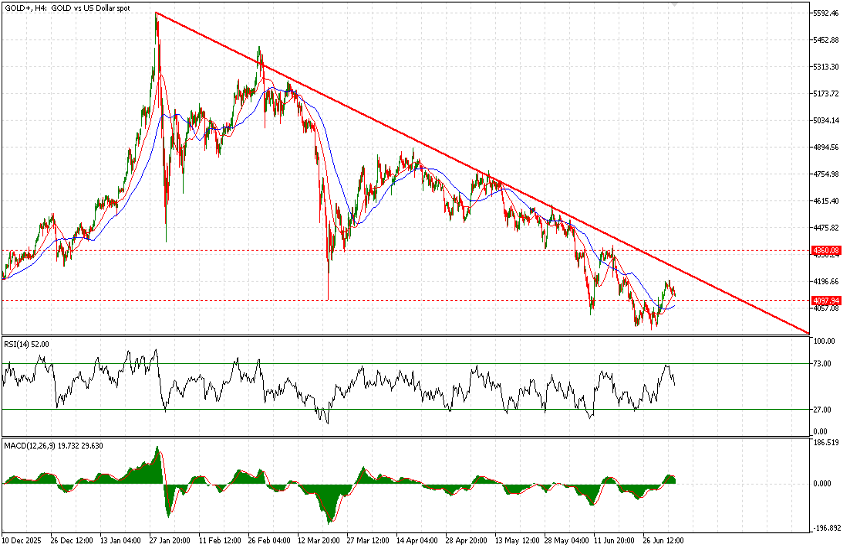
Gold, 4H, 2026
The descending trendline continues to cap price action and currently sits near $4,260. Only a sustained move above this level would improve the technical outlook.
On the daily timeframe, the 21-day moving average is around $4,146, close to current prices, while the 50-day moving average remains significantly higher at $4,381. Even if gold breaks above the descending trendline, it would still face resistance from both the 50-day moving average and the key $4,360 pivot.
The daily RSI has recovered to 45. Although it remains in bearish territory, it is no longer oversold, leaving room for further downside. At the same time, momentum is no longer sufficiently stretched to support an aggressive bearish outlook.
Overall, rallies continue to be viewed as selling opportunities. The outlook would only turn more constructive if gold breaks above the key technical resistance levels outlined above.
Although a longer-term chart is not included here, the medium- to long-term downside target remains in the $3,300 to $3,600 range. The technical rationale behind this outlook will be explored in more detail in the coming weeks.