
While the Nikkei 225 reached a fresh all time high overnight, companies involved in building AI infrastructure continue to post extraordinary gains. On Tuesday alone, Broadcom rose 5.48%, Cisco gained 5.37%, and Micron advanced 3.14%.
A single mention by Jensen Huang during NVIDIA’s Computex presentation in Taiwan was enough to send Marvell Technology soaring 38.13%. As a result, the stock’s weekly RSI climbed to 96, one of the highest readings ever recorded.
Reports highlighting the exceptional nature of the current rally and concerns over increasingly stretched valuations continue to emerge. However, elevated valuations alone do not necessarily signal that it is time to short the market. They do, however, suggest that investors may wish to reduce long exposure relative to what would typically be considered comfortable under more normal market conditions.
The Shiller CAPE Ratio, one of the most widely followed valuation metrics, currently stands at 42.8. This represents the second highest reading ever recorded, surpassed only by the 44.19 level reached in December 1999, shortly before the collapse of the dot com bubble.
Bloomberg recently published an analysis incorporating several valuation metrics, including Price to Earnings, Forward Price to Earnings, Price to Book, Price to Sales, Enterprise Value to EBITDA, and Market Capitalization to GDP. The resulting composite index ranked today’s market as the most expensive of the past century, even more richly valued than the period leading up to the Great Crash of 1929.
Technology stocks have rallied 42% over the past two months, marking the second fastest advance of the 21st century.
Additional indicators point to increasingly optimistic market sentiment. Call option activity now accounts for roughly 70% of total options volume. Short interest has fallen to levels last seen during the Global Financial Crisis. Consensus earnings per share growth expectations have climbed to 24%, a figure rarely observed outside periods of economic recovery following recessions.
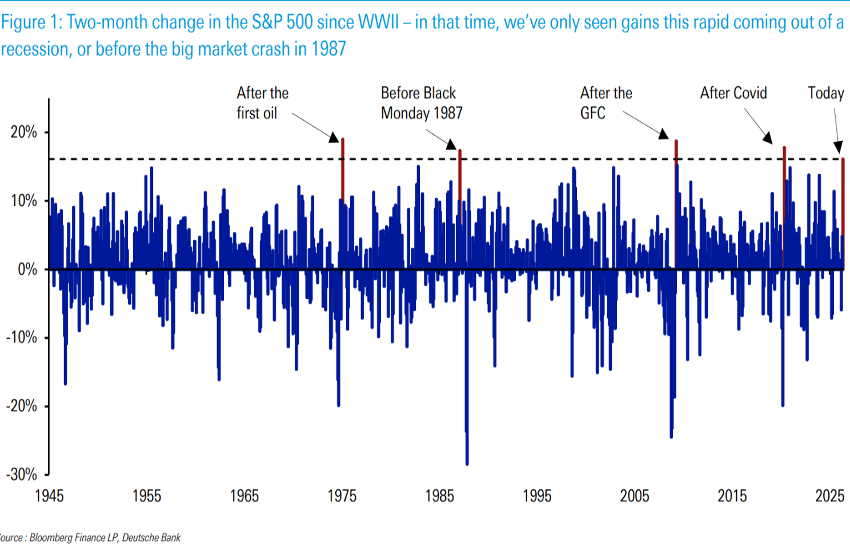
A chart published by Deutsche Bank highlights another unusual development. Historically, markets have never advanced at such a rapid pace without first emerging from a severe economic downturn. No such recession has occurred in the current cycle.
The study identified all streaks of consecutive weekly gains using a relatively broad filter. A rally was considered intact until a drawdown of at least 4% occurred. We then measured the correction that followed each streak.
As of last Friday, the current advance had recorded nine consecutive weeks of gains and delivered a return of 19.71% from its lows.
Using the 4% threshold, history reveals several significantly longer winning streaks, including one lasting 27 weeks. Interestingly, those longer rallies produced only moderately larger gains than the current move.
Across all previous streaks in our sample, the average subsequent drawdown was 10.09%, with a standard deviation of 7.30%.
While historical patterns do not guarantee future outcomes, they suggest that periods of exceptional strength are often followed by meaningful corrections.
| Rank | Start Date | End Date | Amplitude (%) | Weeks | Drawdown After Streak (%) |
| 1 | 2025-04-20 | 2025-10-26 | 29.14 | 27 | -6.01 |
| 2 | 2023-10-22 | 2024-04-07 | 21.5 | 24 | -5.96 |
| 3 | 2026-03-29 | 2026-05-31 | 19.71 | 9 | 0 |
| 4 | 2020-11-01 | 2021-01-17 | 16.76 | 11 | -4.49 |
| 5 | 2020-06-28 | 2020-08-23 | 16.4 | 8 | -8.66 |
| 6 | 2023-03-12 | 2023-08-06 | 15.5 | 21 | -4.26 |
| 7 | 2020-04-05 | 2020-04-12 | 15.38 | 1 | -5.8 |
| 8 | 2019-09-29 | 2020-02-16 | 12.54 | 20 | -35.78 |
| 9 | 2024-09-08 | 2024-12-08 | 12.23 | 13 | -5.51 |
| 10 | 2021-02-28 | 2021-05-02 | 11.05 | 9 | -4.81 |
TECHNICAL ANALYSIS
The rally itself has been discussed extensively. From a technical perspective, one factor deserves particular attention beyond the overbought RSI and the slight bearish divergence currently visible on the chart: volume.
Volume data is generally unavailable on CFD platforms. However, among traditional technical analysts, volume remains one of the most important indicators after price action itself.
Periods of unusually high trading volume often signal that a significant level has been reached and that market participants should monitor price action more closely.
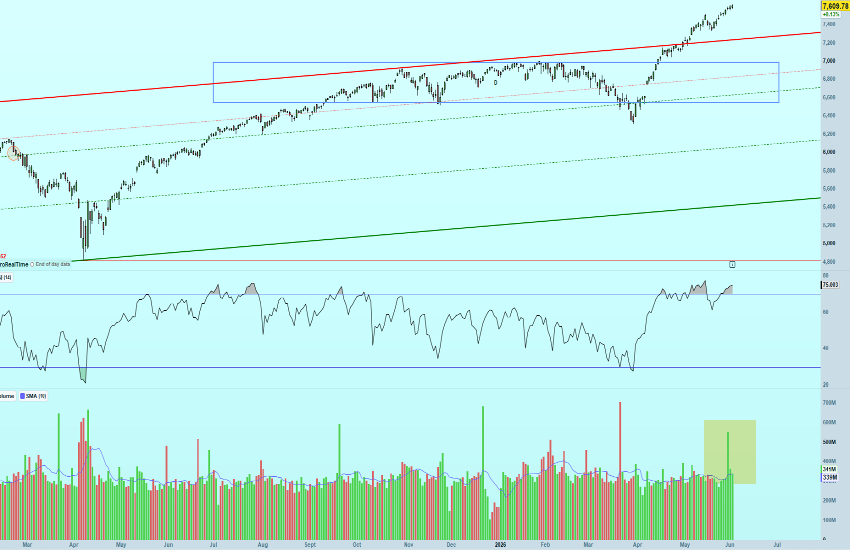
Last Friday’s trading volume was exceptionally high.
Although the final trading day of the month can naturally produce elevated activity, volumes over recent months have not approached the levels recorded during that session.
Some observers may point to previous volume spikes shown on the chart. However, those instances coincided with quarterly futures and options expirations, commonly referred to as Quadruple Witching sessions. Such spikes are largely driven by rollover activity and therefore carry less significance as standalone technical signals.
On May 29, after the market reached the 7,600 level and extended toward the 7,620 area, underlying activity increased substantially. The combination of elevated participation and unusually strong volume near these levels suggests that market positioning remains highly active.
Whether this activity ultimately signals continued momentum or an approaching exhaustion phase remains to be seen. Nevertheless, the volume profile observed near current highs is a development that warrants close attention in the sessions ahead.

