The three worst-performing stocks within the DJ30 over the past three months all belong to the Consumer / Consumer Staples sector: Nike, Home Depot, and McDonald’s. This is particularly relevant given that consumer spending accounts for roughly 70% of U.S. GDP, compared with approximately 53% in the European bloc. Weakness across major consumer-linked companies may therefore provide important signals about the underlying condition of the U.S. economy and the sustainability of broader equity-market strength, beyond the current AI-driven CapEx cycle supporting large technology firms.
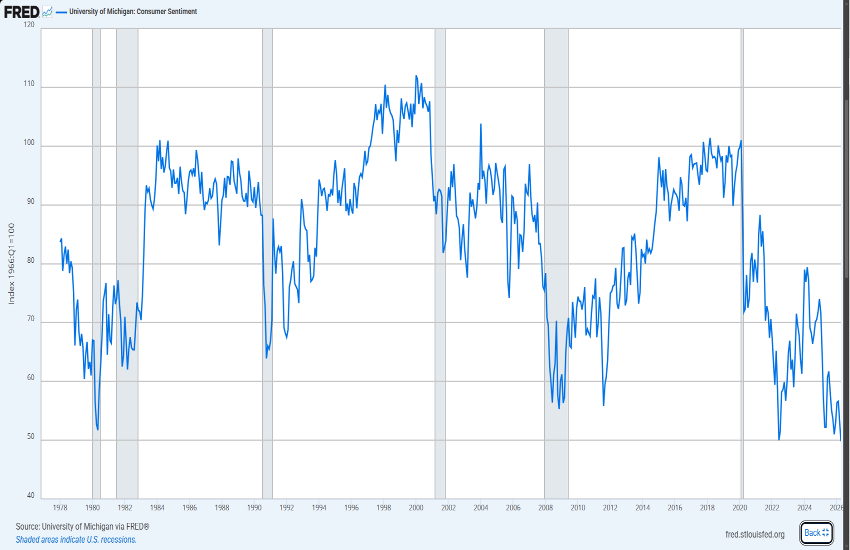
The U.S. consumer remains far from optimistic. The two most widely followed indicators in this area are Consumer Sentiment, published by the University of Michigan, and Consumer Confidence, published by the Conference Board. The University of Michigan reading reached 49.8 in April, the latest available figure, remaining near historical lows since the series began in 1978.
As recently as late 2019, just before Covid, the index was near the 100 level and has never fully recovered since then. Current readings are even lower than those recorded during recent recessions, including the GFC in 2008. This remains in sharp contrast with the resilience currently observed in equity markets.
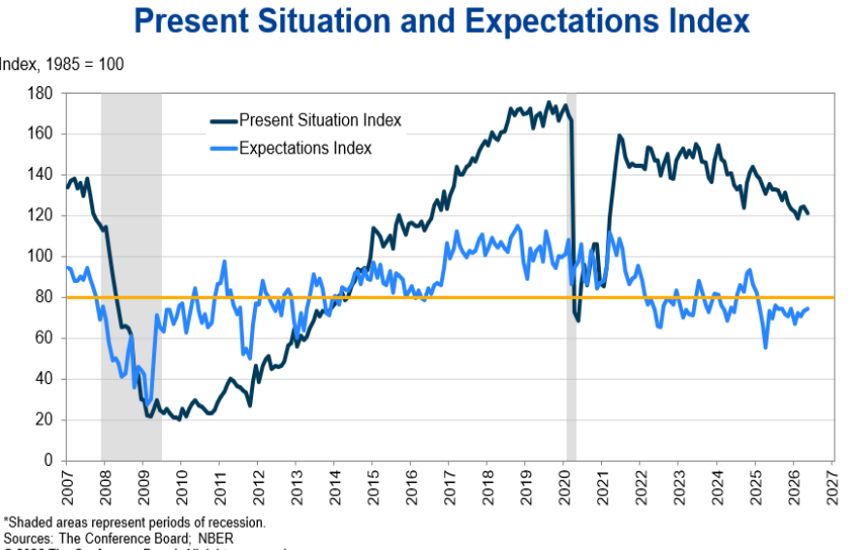
“Consumers’ write-in responses on factors affecting the economy continued to skew towards pessimism in May and net views of their Family’s Current Financial Situation and Family’s Future Financial Situation were both somewhat less positive. References to prices and oil and gas increased in frequency for a second consecutive month. Two-thirds of consumers cited cutting back on spending overall due to rising prices, as of May. Most who are cutting back bought fewer items and delayed expensive purchases. Consumers planned to economize on clothing and footwear, hobby items, and games/toys.”
This is taken directly from the latest Conference Board report and highlights continued pressure on consumer confidence conditions. Although the deterioration remains less severe than during the GFC, the data still points to a consumer environment that has weakened materially in recent years. The two institutions use different methodologies, and the Conference Board series is considerably shorter. Nevertheless, one notable feature is that expectations have continued to lag behind current conditions for years, suggesting that consumers remain cautious about the long-term economic outlook.
Today’s analysis focuses on McDonald’s, while Home Depot and Nike will be examined separately in upcoming reports.
TECHNICAL ANALYSIS
On the technical side, MCD declined by 19.81% from the March high at $339.85, reaching a recent low of $271.97 before rebounding over the last few sessions to yesterday’s close at $279.26. The broader structure on the weekly timeframe, however, remains intact.
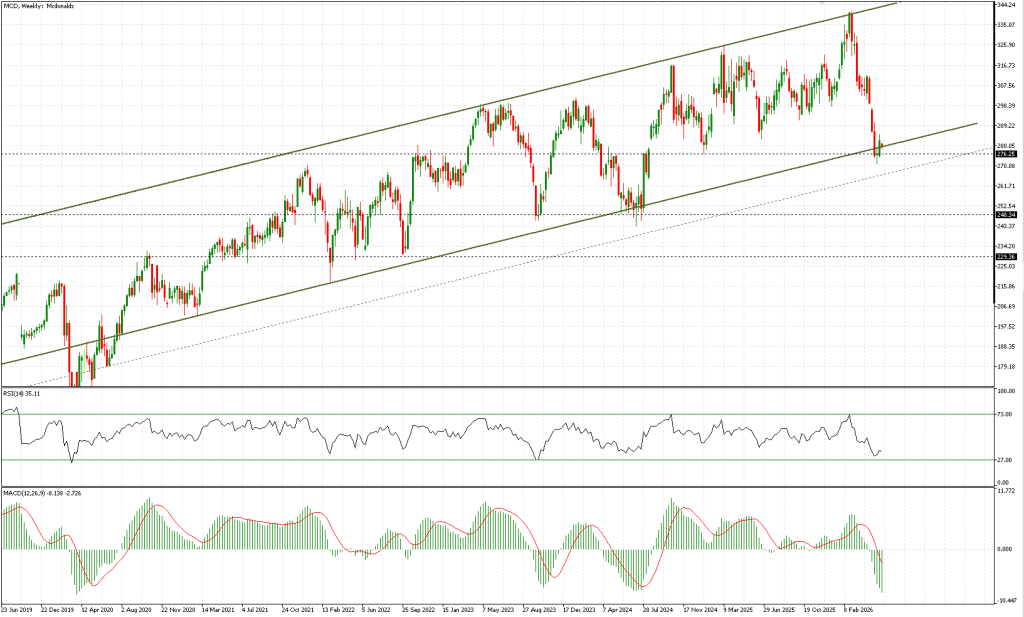
Over the last six years, MCD has continued to trend higher in a relatively orderly fashion. Although the stock has not delivered the exceptional returns seen in the technology sector, it has still posted a respectable gain of roughly 45% since December 2019, excluding the Covid-driven shock, even after the current correction.
At present, the stock is trading near the lower boundary of this long-term channel and has rebounded from a support zone around $275. The channel could potentially extend slightly further to the downside and would not be technically broken even if the stock were to decline toward the $265 area.
What emerges from the current structure is that stocks such as MCD may become increasingly relevant to monitor, particularly in the event of profit-taking within the technology sector and a broader sector rotation. If the large technology components of the index were to decline sharply, the wider market would likely come under pressure and negative sentiment would probably spread to stocks such as MCD as well.
Despite this, selling pressure in defensive consumer names could prove less aggressive, potentially offering a degree of relative protection. In addition, because the stock is not trading near all-time highs, there are more technical reference points available for a broader chart analysis.