The Dow Jones Industrial Average (US30) finally joined the all-time high club last Thursday, May 21, 2026, closing at fresh record highs. While the S&P 500 and Nasdaq had already been trading at record territory since mid-April, the Dow lagged behind before eventually catching up with the broader US equity rally.
The delay can largely be explained by the structural differences between the indices. The DJ30 uses a price weighted methodology, meaning stocks with higher share prices carry greater influence regardless of company size. In contrast, both the S&P 500 and Nasdaq are weighted by market capitalization, giving larger companies significantly more impact on index performance.
Sector composition also played an important role. Unlike the tech heavy Nasdaq, the Dow includes a broader mix of traditional sectors such as banking, industrials, consumer stocks, and payment systems.
Below are the top 10 components of the DJ30, their approximate index weightings, and their performance since March 2, 2026, following the escalation of geopolitical tensions involving Iran.
| Ticker | Company | Approx. Weight | Returns Starting 02.03.2026 |
|---|---|---|---|
| GS | Goldman Sachs | 12.13% | +6.49% |
| CAT | Caterpillar | 10.71% | +14.85% |
| MSFT | Microsoft | 5.09% | +6.00% |
| UNH | UnitedHealth Group | 4.73% | +32.17% |
| AMGN | Amgen | 4.13% | -11.52% |
| V | Visa | 4.00% | +3.05% |
| HD | Home Depot | 3.81% | -18.75% |
| AXP | American Express | 3.80% | -10.50% |
| SHW | Sherwin-Williams | 3.76% | -14.68% |
| AAPL | Apple | 3.76% | +14.24% |
Two key observations stand out.
First, the index leadership has not been dominated exclusively by major AI and technology names. Traditional sectors such as financials, industrials, and consumer companies continue to hold significant influence within the DJ30.
Second, return dispersion across components has been exceptionally wide. UnitedHealth Group delivered gains of more than 32% despite a relatively modest index weighting of 4.73%, while Home Depot declined nearly 19% with a similar weighting.
Overall, only 13 of the 30 DJ30 components have posted gains since the start of the conflict with Iran, with an average advance of 13.71%. Cisco, UnitedHealth Group, and Amazon were among the strongest performers. Meanwhile, the remaining 17 stocks declined by an average of 10.30%, led by Nike, Home Depot, and McDonald’s. The weakness in several consumer oriented names continues to raise concerns about underlying US consumer strength.
This broad divergence in stock performance and sector exposure helps explain why the Dow joined the rally later than other US indices.
Technical Analysis
The US30 has traded within a highly orderly bullish channel since the rebound that followed the April 2025 tariff related selloff. Over time, the technical structure became increasingly well defined.
On March 5, the bullish channel was decisively broken following an initial breach on March 3. The subsequent decline eventually found support near the previous historical double top formed in December 2024 and January 2025 around the 45,000 area. From there, the index staged a strong rebound toward current levels.
An important technical detail is that until last Friday, the recovery largely represented a retest of the broken channel from below. Only during the latest sessions has the US30 fully reclaimed the channel structure nearly three months after the breakdown.
The 50,250 level remains particularly significant as it marks the previous all-time closing high.
Many analysts remain concerned about elevated market valuations, and those concerns are understandable given the sharp rally in equities. However, momentum driven markets continue to make it difficult for investors to remain underexposed while indices keep pushing higher.
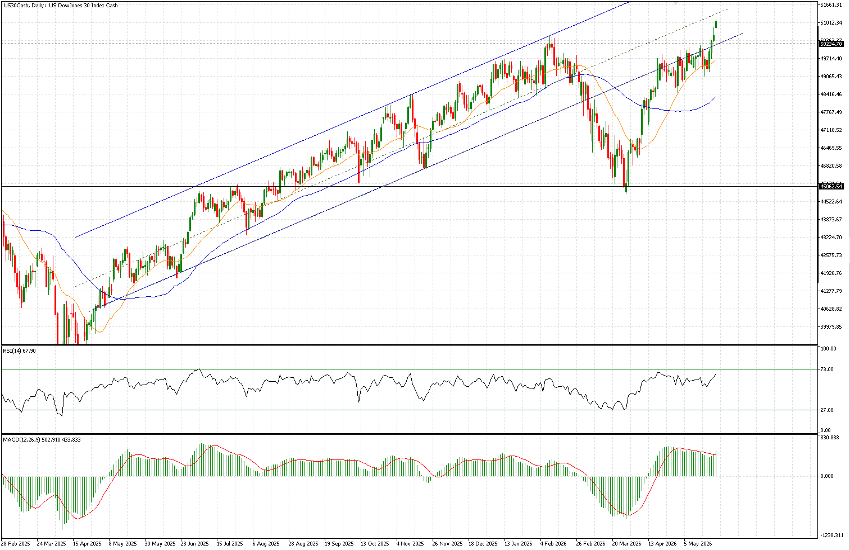
From a technical perspective, further upside remains possible toward the midpoint of the bullish channel, which is projected near 51,300, with current prices trading around 51,050.
At the same time, much of the optimistic geopolitical scenario may already be priced into the market. Any negative geopolitical developments or a wave of profit taking could quickly pressure equities lower.
Key support levels to monitor include:
- 50,250, the previous all-time closing high
- 49,650, near the 21 day moving average
- The broader 49,000 support zone below
Despite valuation concerns and geopolitical uncertainty, the broader trend remains firmly bullish, with US equities continuing to demonstrate remarkable resilience throughout the spring rally.