Global equity markets are lower this morning following yesterday’s turbulence in gold and other precious metals. XAUUSD, after reaching $5,600, experienced heavy profit-taking that pushed prices down toward $5,030 before closing at -1.35% (currently down a further 4.38% today). In addition, markets are expecting President Trump to announce the next Fed Chair later today (U.S. time).
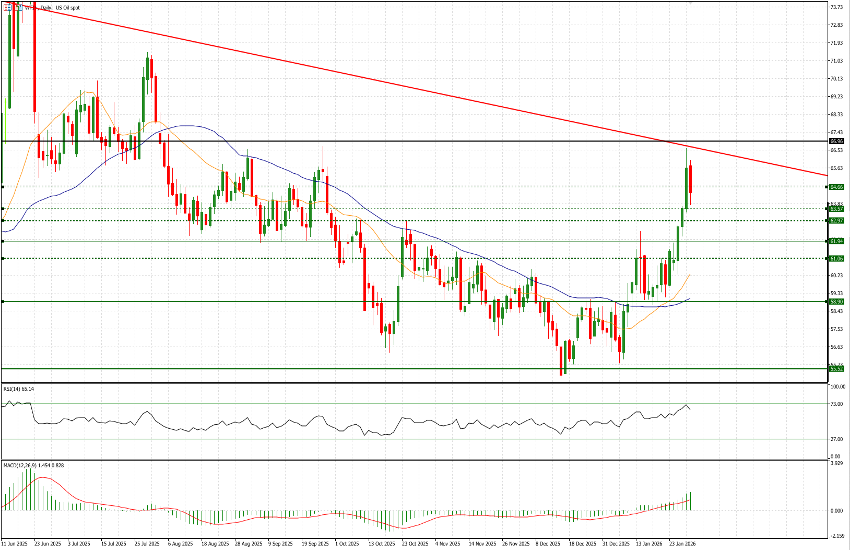
With this as a backdrop, today we turn our attention to another key commodity that we have somewhat neglected in recent weeks and that has finally emerged from its lethargy, gaining 21% from its December lows and trading yesterday at technically very interesting levels: Crude Oil (WTI).
Without venturing into macroeconomic or geopolitical analysis, we will focus directly on the chart, starting—as is our custom—with a broader perspective. August 2023 marked the multi-year highs around $95 for black gold. Since then, prices have failed to break above that level, fitting the textbook definition of a bearish trend, characterized by lower highs and lower lows. Throughout 2024, WTI found very strong support around the $67 area, a level that was tested multiple times and held for an extended period. This changed in March 2025, when a break below that support triggered a rapid 16% sell-off to approximately $55.50. From that point on, aside from a brief upward move in June, prices were unable to trade back above $67, repeatedly testing the $55.50 level and, in recent months—from October until a few days ago—trading within the $57.50–$61.50 range.
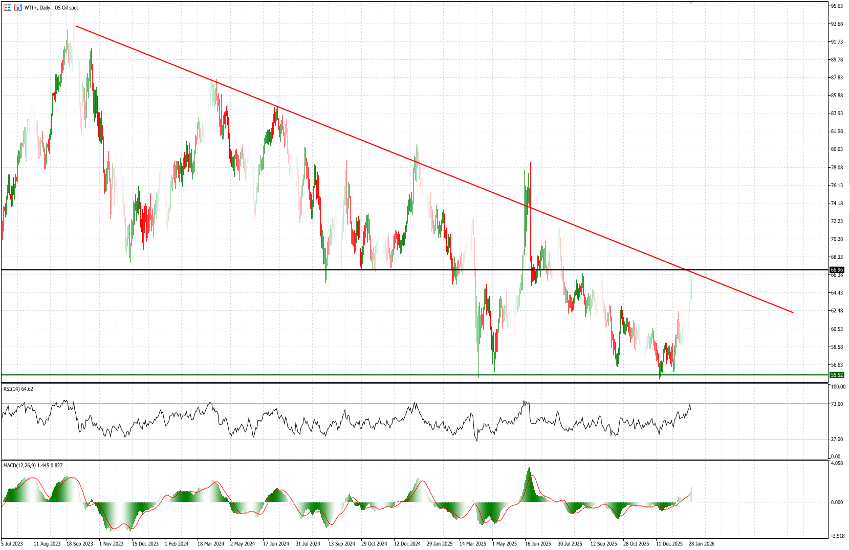
Yesterday, following an 11.68% rally over five sessions—unusual given WTI’s sluggish behavior in recent weeks—prices reached both the $67 area and the descending trendline (the latter should be treated with some caution, given the multiple spikes that have distorted it over the past 2.5 years of decline). After testing such a critical level, WTI is down around 2% today and is currently trading at $64.40. A pullback at this stage is natural; however, indicators suggest that we may be in the early phase of a broader move higher, with additional upside potential over the coming weeks.
On the downside, we will be closely monitoring levels such as $63.50, $63, and especially $62 as potential entry zones. A break above $67—which we do not expect in the next few sessions—would likely trigger a decisive extension higher and could lead to WTI stabilizing within a higher price range compared to recent months.