U.S. equity futures edged higher early Tuesday, August 25, as investors cautiously repositioned ahead of a pivotal week for markets. The S&P 500 had slipped in the previous session as technology and semiconductor stocks came under pressure, while traders reduced risk exposure ahead of Nvidia’s earnings and the latest U.S. inflation data.
S&P 500 futures gained around 0.2%, while Nasdaq 100 futures advanced 0.5%. Dow futures were broadly flat. The cautious rebound comes after the S&P 500 fell 0.28% on Monday and the Nasdaq Composite declined 0.76%, while the Dow gained 0.26%. Reuters reported that weakness in Nvidia and other semiconductor stocks weighed on the broader market as investors awaited the chipmaker’s results.
The market is now focused on whether the recent pullback represents a temporary pause within the broader uptrend or the beginning of a deeper correction. With Nvidia scheduled to report its second-quarter fiscal 2027 results on Wednesday, August 26, the reaction could extend well beyond the semiconductor sector.
Technical Analysis
The S&P 500 closed at 7,652.86, pulling back from its recent high of 7,816.70. Based on the daily chart, the broader bullish structure remains intact for now as long as price holds above the 23.6% Fibonacci retracement at 7,462.75, which represents the key near-term support. Holding this level would keep the 7,800–7,816.70 area in focus, while a decisive break above 7,816.70 would strengthen the bullish continuation setup. If 7,462.75 breaks, the next Fibonacci supports on the chart are 7,243.78 and 7,066.81.
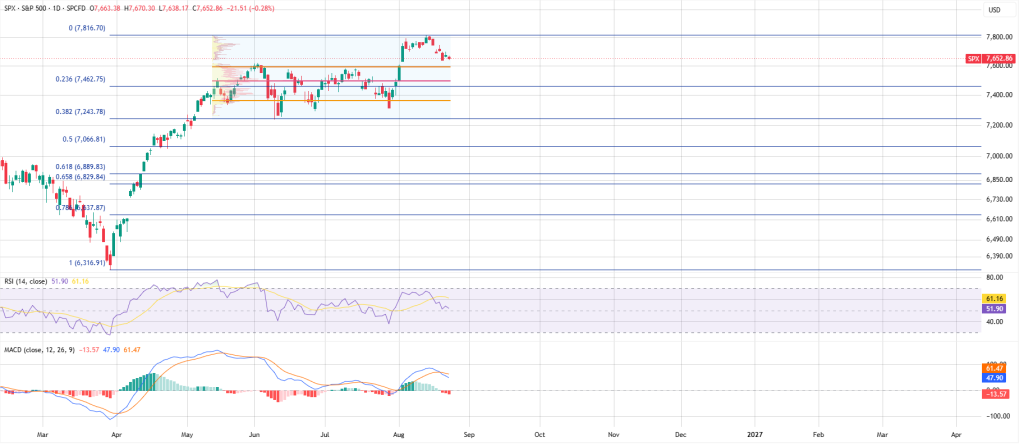
Momentum indicators are becoming less supportive. RSI stands at 51.90, below its moving average near 61.16, while the MACD line at 47.90 remains below the signal line at 61.47, with the histogram at -13.57. This points to weakening short-term momentum, but does not by itself confirm a bearish reversal. Traders should therefore watch whether SPX can defend 7,462.75 and regain momentum before another test of the recent high.
Fundamental catalysts could determine the next technical move. Nvidia is scheduled to report its fiscal second-quarter 2027 results on Wednesday after the U.S. market close, while the July PCE inflation report is due earlier that morning at 8:30 a.m. ET. Strong Nvidia results or guidance combined with softer inflation could support technology stocks, while weaker Nvidia guidance or firmer-than-expected inflation could increase pressure on growth stocks.
For traders, the key levels remain 7,462.75 support and 7,800–7,816.70 resistance. Holding support would preserve the current bullish technical structure, while a sustained break below it would increase the risk of a deeper correction toward 7,243.78. A breakout above 7,816.70 would strengthen the bullish continuation scenario. With PCE arriving before Nvidia’s earnings on the same day, traders should focus on price reaction, Treasury yields, Nasdaq and semiconductor performance, volume and momentum confirmation rather than the headlines alone.