

Analysing assets in gold terms is a common approach used to assess value relative to a tangible monetary benchmark. Expressing economic output, financial assets, and currencies in gold can provide a different perspective on long-term valuation trends.
From 1944 to 1971, the global economy operated under the Bretton Woods system, named after the town in New Hampshire where the agreement was signed. Under this framework, currencies were effectively linked to gold, meaning governments could issue money only to the extent that it was backed by official gold reserves.
In August 1971, the United States, under President Nixon, ended the dollar’s convertibility into gold, paving the way for the modern monetary system, in which money can be created without direct backing by physical assets.
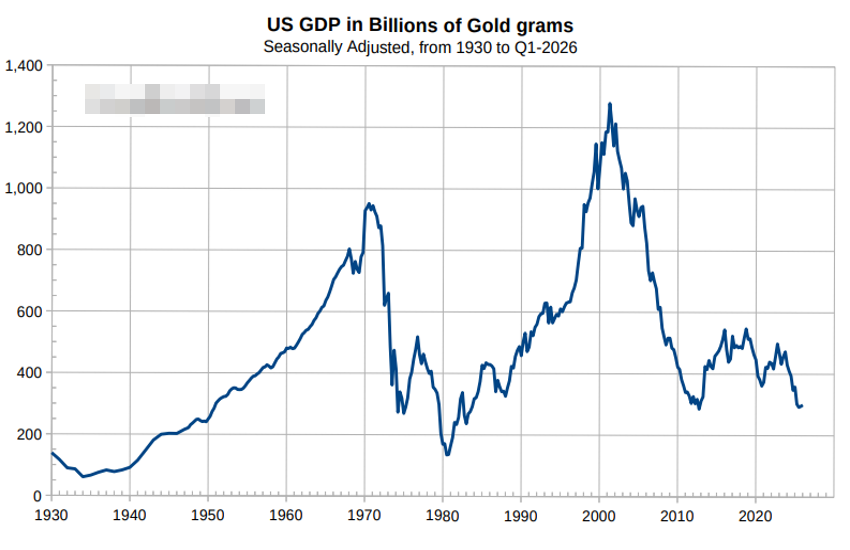
The chart of U.S. GDP measured in gold shows a significant decline since the early 2000s, with current levels comparable to those seen in the mid-1980s and even the mid-1950s.
In recent days, Bitcoin, often referred to as digital gold, has once again retested the critical $60,000 level. Many long-term holders hope this will prove to be a double bottom following a decline of just over 50% from its all-time high.
This comparison raises an important question: where does digital gold currently stand relative to physical gold, and can that relationship provide meaningful insights?
Technical Analysis
The area around $60,000 is now a clear support level. It also served as a major trading range between March and October 2024, before Bitcoin regained momentum, broke above $100,000, and eventually reached highs near $120,000.
Measured in troy ounces of gold, one Bitcoin is currently worth approximately 14.85 ounces, after reaching a low near 12.25 ounces in February.
Interestingly, this is the same range where the BTC/XAU ratio traded between March and October 2023, when Bitcoin fluctuated between $25,000 and $30,000, roughly 50% below its current price. The ratio also traded at similar levels in December 2020 and January 2021, when Bitcoin was again near $25,000.
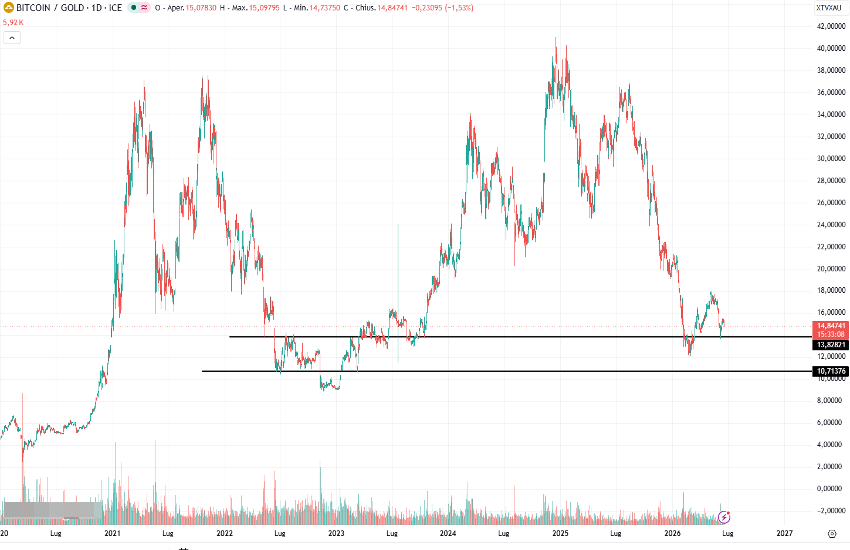
The decline in the BTC/XAU ratio has been steeper than Bitcoin’s decline in U.S. dollar terms. The ratio fell as much as 64% from its all-time high near 41 ounces of gold per Bitcoin in December 2024 and approximately 59% from the relative peak recorded in August 2025.
What may be particularly noteworthy is that current levels are not far above a major long-term support zone between approximately 10.70 and 13.70 ounces. If technical analysis can be applied to a synthetic instrument such as this ratio, it would suggest that downside potential may be relatively limited.
Put differently, Bitcoin appears comparatively inexpensive when measured against gold.
Whether the $60,000 level ultimately holds remains uncertain, with BTC currently trading around $63,795. However, from a medium-term perspective, a long Bitcoin and short gold position could be worth considering, with gold currently trading near $4,298.
Investors should also account for financing and swap costs associated with holding both legs of the trade, as well as the margin requirements needed to maintain the position. These operational costs can become significant over time and should be carefully evaluated before entering the trade.

