


The Australian Dollar held above 0.7000 against the US Dollar on Tuesday, October 27, trading near 0.7024 ahead of Australia’s inflation report and the Federal Reserve’s interest-rate decision. Although hawkish Reserve Bank of Australia (RBA) expectations support the Aussie, its recovery has yet to confirm a broader bullish reversal.
The RBA raised its benchmark rate to 4.60% in September, its highest level in 15 years, as inflation remains persistent. Australia’s September CPI is expected to rise to 4.2% year-on-year from 4.0%, while monthly inflation is forecast to accelerate to 0.7% from 0.4%. Stronger readings could reinforce expectations of further rate hikes, supporting AUD/USD, while softer data may trigger renewed selling pressure.
The Federal Reserve is expected to hold rates at 3.75%–4.00%, but its policy guidance could shape expectations for future tightening. Hawkish remarks may strengthen the US Dollar and limit AUD/USD gains, while a less aggressive stance could support the Australian currency. US durable goods orders, employment indicators, third-quarter GDP and September PCE inflation will provide further clues. With both central banks influencing the outlook, conflicting signals could increase volatility and make the pair’s next direction dependent on incoming data.
Technical Analysis
AUD/USD is trading near 0.7024 on the daily chart, testing the 0.70255 Fibonacci 0.382 retracement level after rebounding from its October low near 0.68942. The Relative Strength Index (RSI) stands at 52.26, above the neutral 50 threshold, while the Moving Average Convergence Divergence (MACD) line remains above its signal line with a positive histogram, indicating improving bullish momentum. However, both MACD lines are still below zero, suggesting the recovery has yet to confirm a broader bullish trend reversal.
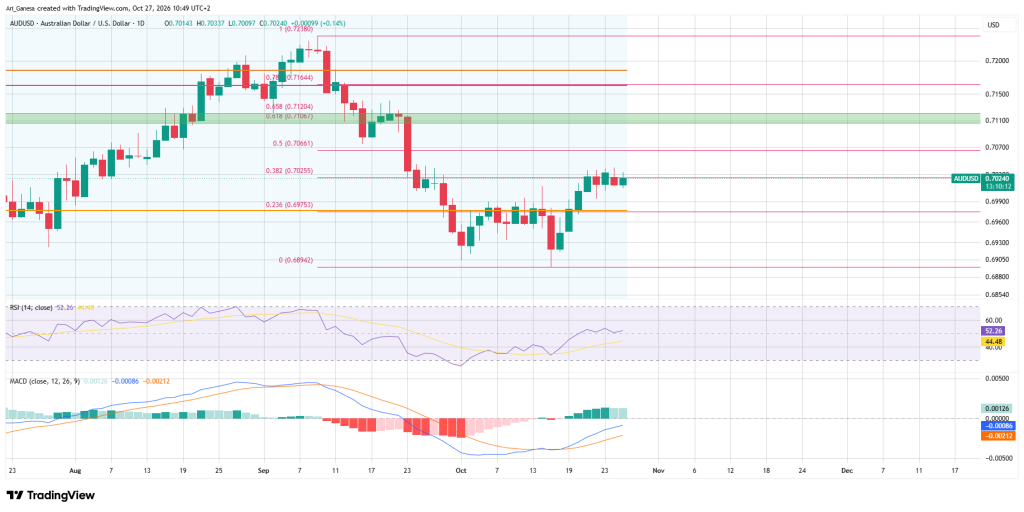
On the upside, a sustained daily close above 0.70255 could open the way toward the 0.70661 Fibonacci 0.5 retracement, followed by 0.71067, near the key 0.7100–0.7110 resistance zone. Conversely, rejection at the immediate resistance could push the pair toward support at 0.69753–0.6978. A decisive break below this area would expose the October low near 0.68942 and weaken the current recovery. These levels are based on the supplied daily chart and serve as technical reference points rather than guaranteed price targets.
AUD/USD maintains a cautiously bullish outlook, with a confirmed break above 0.70255 needed to target 0.70661 and 0.71067. Strong Australian inflation and a less hawkish Fed could support gains, while weaker CPI or hawkish Fed guidance could push the pair below 0.69753. Conflicting signals may keep prices range-bound.
Australian CPI and the Fed decision could trigger sharp volatility. Traders should monitor data surprises, wait for price confirmation, and manage position sizing, stop-losses, and slippage risk.