U.S. stock futures moved lower early Thursday, October 8, as investors weighed elevated Treasury yields, a pullback from record highs and the start of the third-quarter earnings season. The S&P 500 fell 0.2% in the previous session after reaching an all-time high, while the Dow Jones Industrial Average dropped more than 340 points and the Nasdaq Composite declined 0.2%.
Dow futures were down 0.26%, while S&P 500 and Nasdaq-100 futures slipped 0.15% and 0.21%, respectively. Meanwhile, the 10-year Treasury yield remained around 5.32% after touching 5.365% in the previous session, its highest level since 2002, while the 30-year yield climbed to around 5.71%.
Despite pressure from higher yields, investors remain optimistic about corporate earnings, with expecting roughly 30% year-over-year earnings growth for the S&P 500 in the third quarter. This leaves the market balancing two opposing forces: strong corporate profits and increasingly elevated borrowing costs.
If earnings and forward guidance remain strong, they could help support equity valuations despite higher yields. However, if earnings disappoint while Treasury yields continue to rise, stocks could become more vulnerable to a deeper pullback.
Technical Analysis
From a technical perspective, the S&P 500 remains constructive after recovering to around 7,801.77, but the index is now approaching major resistance at 7,844–7,850. A decisive daily close above 7,844.52 would strengthen the bullish setup and potentially open the way toward the 7,900 psychological level. However, failure to break this zone could trigger profit-taking after the recent rally.
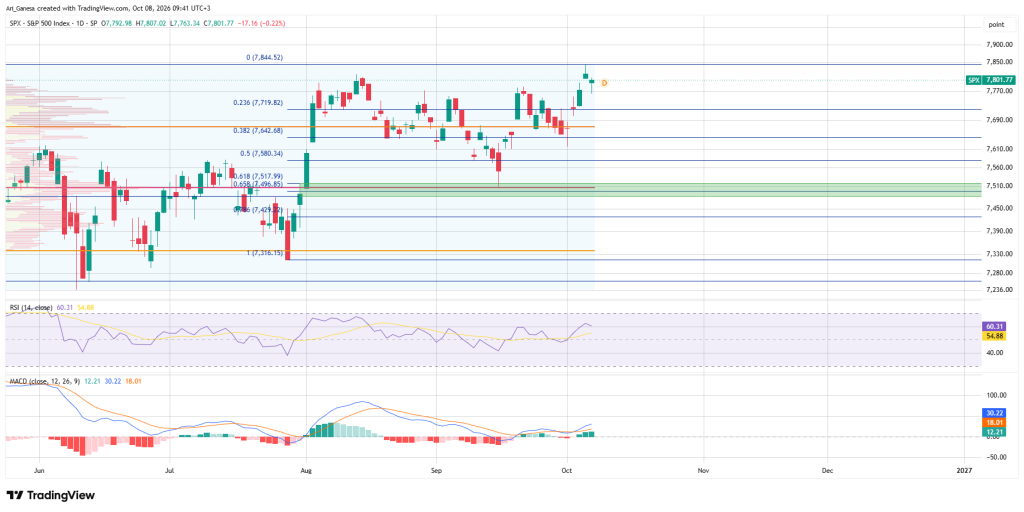
The key downside level is 7,719.82, the 23.6% Fibonacci retracement. Holding above it keeps the short-term bullish structure intact, while a break below could expose 7,642.68 and 7,580.34, with the 7,500–7,520 area acting as a deeper support zone. Momentum indicators remain supportive, with RSI at 60.31 and MACD still bullish, although traders should watch for weakening momentum or bearish divergence if the index makes a new high.
For traders, the interaction between SPX price action, Treasury yields and incoming economic data is more important than any single headline. If yields continue rising while the S&P 500 fails to break 7,845, the risk of profit-taking and a deeper correction increases. If yields stabilize and earnings remain strong, a breakout above 7,845 could provide the next bullish catalyst.
The key levels for today’s session are therefore 7,845 on the upside and 7,720 on the downside. A break of either level could provide a clearer signal about the S&P 500’s next directional move.