The Dow Jones Industrial Average remained under pressure on Tuesday, September 29, after Wall Street suffered another losing session as rising Treasury yields continued to weigh on U.S. equities.
Dow Jones futures were down around 0.12% in early trading, while S&P 500 futures fell roughly 0.7% and Nasdaq-100 futures edged 0.04% lower. The weakness followed Monday’s session, when the Dow Jones dropped more than 300 points, or 0.67%, to close at around 51,487.
The decline also extended weakness across Asia. Japan’s Nikkei 225 and Topix both fell, while South Korea’s Kospi, Hong Kong’s Hang Seng and China’s CSI 300 also traded lower. The broader market tone suggests investors remain cautious as higher interest rates continue to reshape risk appetite.
The biggest macro risk for the Dow Jones remains rising U.S. Treasury yields. The 10-year yield moved above 5.2%, while the 30-year yield topped 5.5%, making bonds more attractive and increasing pressure on equity valuations. With markets reassessing the Federal Reserve’s rate path following its September hike, further increases in yields could weigh on the Dow, while softer inflation or labor data could ease pressure.
Traders now await key U.S. economic data, including Tuesday’s JOLTS report, Wednesday’s PCE inflation data, and Friday’s Nonfarm Payrolls. Core PCE is forecast at around 3.4% year over year, while job growth is expected to slow from August and unemployment to remain near 4.1%. Stronger-than-expected data could reinforce higher-rate expectations and pressure equities, while weaker readings could support stocks by easing concerns over further tightening.
Technical Analysis
From a technical perspective, the Dow Jones remains bearish on the daily chart. The index is trading near 51,487, below the descending trendline and beneath the key Fibonacci levels at 52,512 and 52,940, which now act as important resistance areas. Momentum indicators also remain weak, with the RSI around 40.2, below the neutral 50 threshold but not yet in oversold territory, while the MACD remains firmly negative, indicating that selling momentum is still dominant.
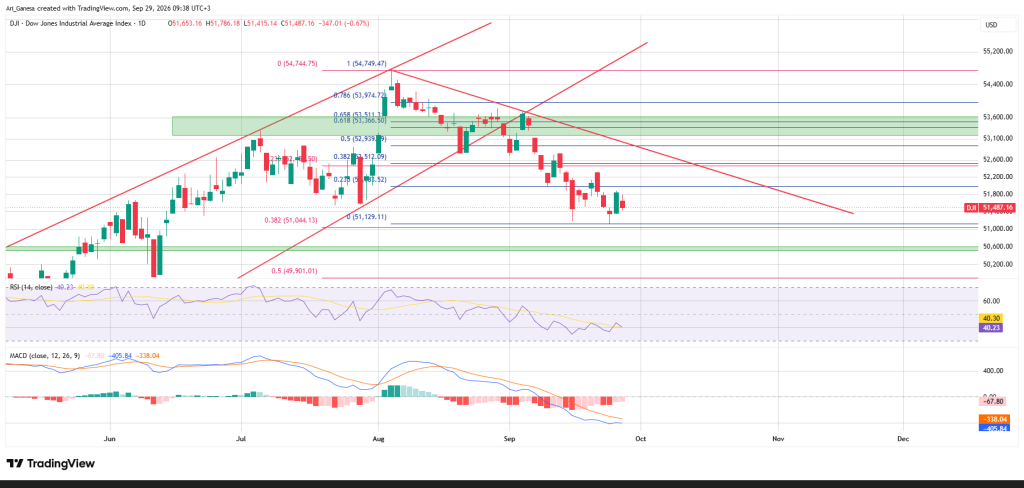
On the downside, the 51,129–51,044 region is the first major support zone; a decisive break below this area could expose the 50,600 level, followed by the 49,900–49,000 region. On the upside, a sustained recovery above 52,512would signal initial stabilization, although the broader 53,100–53,600 resistance zone remains a significant barrier for buyers.
With the Dow Jones trading below 51,500, the 51,129–51,044 zone is the key support to watch, with a break potentially exposing 50,600 and then 49,900–49,000. On the upside, 52,512 and 52,940 are the first resistance levels, followed by the 53,100–53,600 zone. The technical setup remains cautious as RSI sits near 40 and MACD stays negative, while elevated Treasury yields and upcoming U.S. PCE inflation and Nonfarm Payrolls data could drive further volatility. For traders, the interaction between these technical levels and fresh macroeconomic data will be crucial in determining whether the Dow Jones stabilizes or extends its decline.