The U.S. 10-year Treasury yield climbed above 5% on Tuesday, September 15, reaching its highest level since 2007 as investors continued to sell government bonds ahead of the Federal Reserve’s latest policy meeting. Persistent inflation and expectations for tighter monetary policy have pushed Treasury yields higher.
The benchmark 10-year yield gained more than 6 basis points to 5.025%, after briefly crossing the 5% threshold on Monday before pulling back slightly. Since Treasury prices and yields move in opposite directions, the latest move reflects continued selling pressure in the U.S. government bond market.
The rise was also seen across other maturities. The 30-year Treasury yield climbed more than 5 basis points to 5.384%, while the 2-year Treasury yield rose around 4 basis points to 4.68%. The move comes as investors reassess the Federal Reserve’s monetary policy outlook.
Markets are increasingly pricing in another 25-basis-point rate hike, with inflation remaining above the Fed’s 2% target. Higher Treasury yields can create additional pressure on equities by increasing borrowing costs and making fixed-income assets more attractive. The effect can be particularly significant for growth and technology stocks, whose valuations are more sensitive to changes in interest rates.
Technical Analysis
The daily chart shows the S&P 500 closing at 7,619.98, down 0.48%, after failing to maintain its recovery toward the 7,700 area. Price is now hovering around the 7,624.64 Fibonacci resistance, making this level important for the next directional move.
A sustained break above 7,624 could strengthen the bullish recovery and shift attention toward 7,698.04. If buying momentum continues, the next major resistance is located around 7,816.70, near the recent record high.
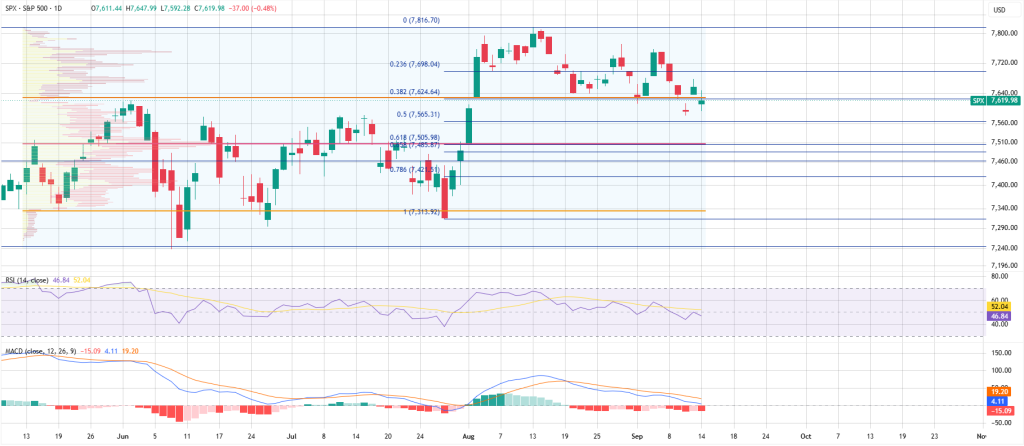
On the downside, the first key support is around 7,565.31, corresponding to the 0.5 Fibonacci retracement. A break below this level could expose 7,505.98, followed by the 7,485–7,460 zone. The next major support is around 7,421.51.
Momentum indicators remain cautious. RSI stands at 46.84, below its average near 52, showing that bullish momentum has weakened without reaching oversold conditions. At the same time, MACD remains bearish, with the MACD line below the signal line and the histogram in negative territory.
For traders, 7,624 and 7,565 are the key levels to monitor. A breakout above 7,624 would favor a move toward 7,698, while a break below 7,565 would increase the risk of a deeper correction toward 7,506 and potentially 7,421.
The Fed decision and its forward guidance could determine whether the index breaks out of this range or extends its decline. A hawkish tone could reinforce pressure on equities, while a dovish signal could provide room for the S&P 500 to recover.