EUR/JPY traded near 186.40 during Thursday’s Asian session as buyers pushed the pair toward a key resistance zone. Persistent weakness in the Japanese yen and renewed demand for the euro have supported the recent advance, leaving the cross within striking distance of its record high.
The broader technical picture remains constructive, with EUR/JPY continuing to post higher lows while momentum indicators favor further upside.
The latest rally has been supported by expectations that the Bank of Japan will maintain a gradual approach to policy normalization, while resilient economic conditions in the Eurozone continue to underpin the euro. This policy divergence has helped keep EUR/JPY in a well-established uptrend, with traders closely watching whether buyers can generate enough momentum to break above the next major resistance level.
Technical Analysis
The daily chart shows EUR/JPY challenging resistance around 186.40–186.50 after extending its recent advance. A decisive break above this zone could encourage fresh buying interest and open the door to a move toward 187.55, with the all-time high near 187.95 remaining the next major upside target.
Momentum indicators continue to favor the bulls. The 14-day Relative Strength Index (RSI) has climbed to around 69, approaching overbought territory while continuing to signal strong buying pressure. Meanwhile, the Moving Average Convergence Divergence (MACD) remains in positive territory, with the MACD line holding above the signal line, reinforcing the prevailing bullish momentum.
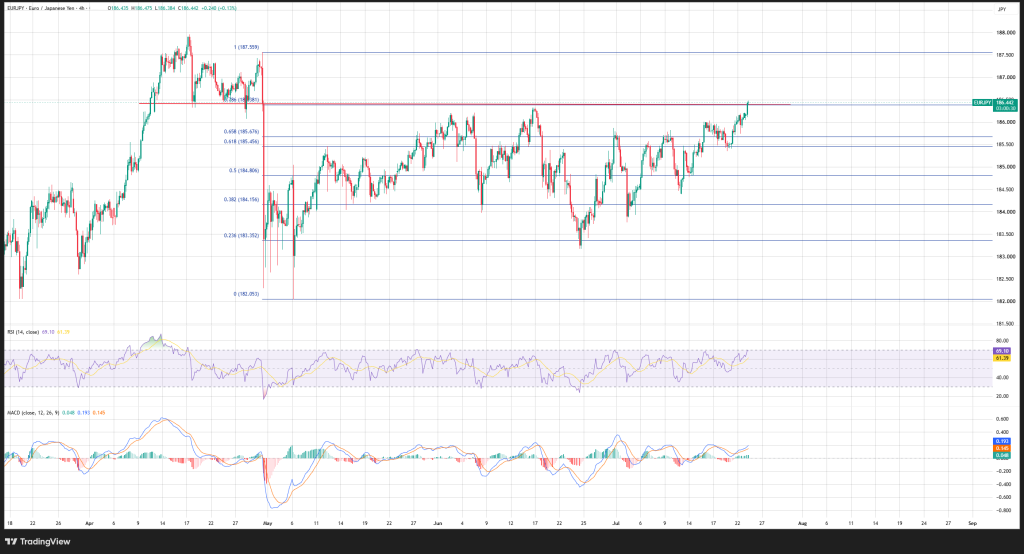
Should EUR/JPY encounter selling pressure, initial support is located around 185.68, followed by 185.46. These levels have provided reliable support in recent weeks and could serve as a base for another upside attempt if tested. A break below 184.80 would weaken the near-term bullish outlook and expose the pair to a deeper correction toward 184.15.
For traders, EUR/JPY is approaching a technically significant level. A confirmed breakout above the 186.50 resistance could strengthen bullish momentum and open the door to a retest of the 187.55–187.95 region. However, with the RSI nearing overbought territory, traders should also watch for signs of fading momentum or a short-term pullback before the next directional move develops.