

Hyperscalers have been among the primary drivers of the equity market rally over the past several quarters, supported by an unprecedented wave of investment in artificial intelligence infrastructure. Amazon, Microsoft, Alphabet, and Meta continue to increase capital expenditures aggressively as they race to expand computing capacity and data centre infrastructure.
Combined spending is projected to rise from $410 billion in 2025 to approximately $725 billion this year, representing a 77% year-over-year increase. Goldman Sachs forecasts investment could reach $1.1 trillion next year, contributing to more than $5 trillion in cumulative spending between 2025 and 2030. At that scale, annual investment would represent roughly 3.5% of U.S. GDP, exceeding the relative size of several historic infrastructure expansion cycles, including railway development and nationwide electrification.
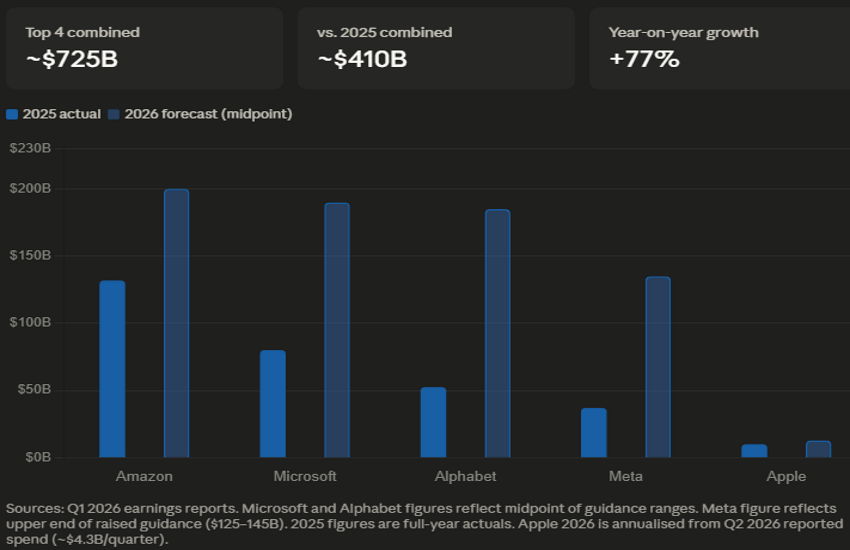
The scale of this investment is placing increasing pressure on corporate cash flows. According to Morgan Stanley, approximately 94% of the cash flow generated by these companies is expected to be absorbed by capital expenditures.
Amazon appears particularly exposed. With projected capital expenditures of approximately $200 billion against operating cash flow of roughly $139 billion, the company is expected to move into negative free cash flow territory.
The investment cycle is also driving increased reliance on debt markets. Collectively, hyperscalers are expected to raise approximately $400 billion in financing this year alone. Meta recently issued $25 billion in debt, while Amazon’s long-term debt has nearly doubled over the past year, rising from $65.6 billion to $119.1 billion. Alphabet has also been active in capital markets, issuing $30 billion in debt in February, including a rare 100-year sterling bond, while reportedly raising an additional $80 billion through equity issuance.
Despite the scale of investment, shareholder returns have been mixed.
Year-to-date, Amazon is up 5.80%, Microsoft is down 21.48%, Meta has declined 12.40%, while Alphabet has gained 17.41%. Looking back to the start of 2025, Amazon is up 11.62%, Microsoft is down 8.74%, Meta is down 0.64%, and Alphabet has surged 91%.
Excluding Alphabet, equity performance has ranged from modest to disappointing despite the extraordinary scale of capital deployment.
Technical Analysis
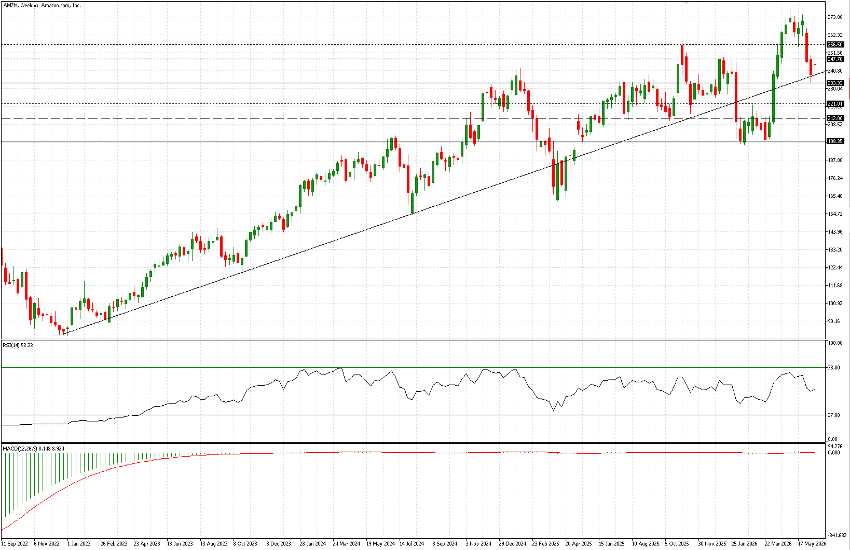
Amazon has once again returned to test its long-term ascending trendline on the weekly chart, a trendline that originated in December 2022. While it has been briefly breached twice during the past 18 months, first during the tariff-driven selloff and later during the escalation of the Iran conflict, price has consistently rebounded from the same area, coinciding with key support at $233.
On the daily chart, June’s decline highlights the importance of the $233 support zone. Additional support levels are located at $221, $212, and $198. On the upside, resistance is positioned at $247.75, followed by $256.
Two descending trendlines remain in place. The steeper of the two continues to cap price action and contributed to renewed selling pressure during Wednesday’s and Friday’s sessions. As long as this trendline remains intact, upside momentum may remain limited despite the latest close at $244.25.
Even a breakout above the descending trendline would leave Amazon facing significant overhead resistance at both $247.75 and $256.
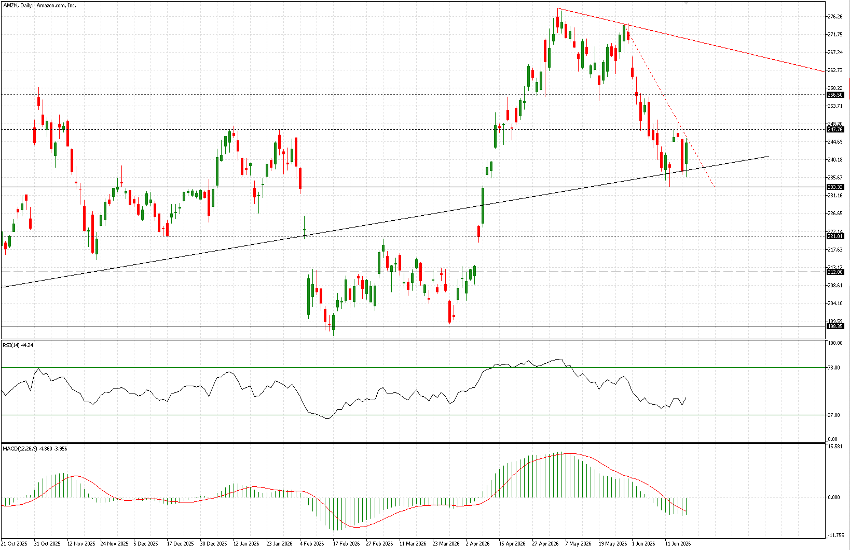
Technical indicators remain weak and suggest Amazon may struggle to outperform in the near term. The key levels to monitor remain $247.75 on the upside and $233 on the downside.

