

This week delivered another strong performance for the Nasdaq, with technology and semiconductor stocks once again leading the market higher. Major U.S. indices—including the S&P 500, Nasdaq Composite, and Russell 2000—posted fresh record highs on Wednesday, supported by strong earnings momentum across the AI and semiconductor sectors.
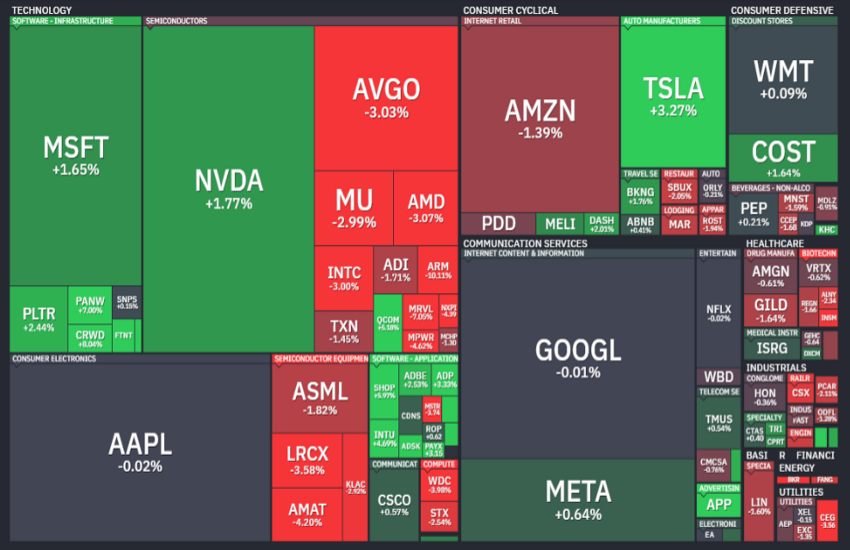
AMD’s latest earnings release provided an additional boost to chipmakers, helping the semiconductor ETF gain 6.59% over the last five sessions. Individual names including Intel, Micron, Broadcom, and AMD itself have advanced between 15% and 20% since last Monday.
Software stocks also performed strongly, gaining 8.27% over the same period, while airlines benefited from lower crude oil prices despite continued concerns surrounding Spirit Airlines’ bankruptcy proceedings.
At the time of writing, the Nasdaq is on track to close the week higher by approximately 3.08%, extending its winning streak to six consecutive weeks and marking a gain of 23.48% from the March lows.
Thursday, however, brought the first signs of a pause. Energy and materials stocks led the pullback as geopolitical tensions surrounding Iran kept investors cautious ahead of Friday’s nonfarm payrolls report. Semiconductor stocks also paused after several sessions of exceptionally strong gains.
TECHNICAL ANALYSIS
The Nasdaq rally began with considerable strength on March 31 around the 22,785 level, followed by an extended sequence of predominantly bullish sessions.
Since breaking above previous all-time highs near 26,270 on April 21, the index has continued accelerating higher, although momentum now appears slightly less aggressive. Since then, six red candles have appeared, suggesting that upside momentum may gradually be slowing.
Yesterday’s session formed a spinning top candlestick near the end of a strong bullish move. In Japanese candlestick analysis, this pattern is often interpreted as a sign of slowing momentum and, in some cases, an early warning of consolidation or reversal.
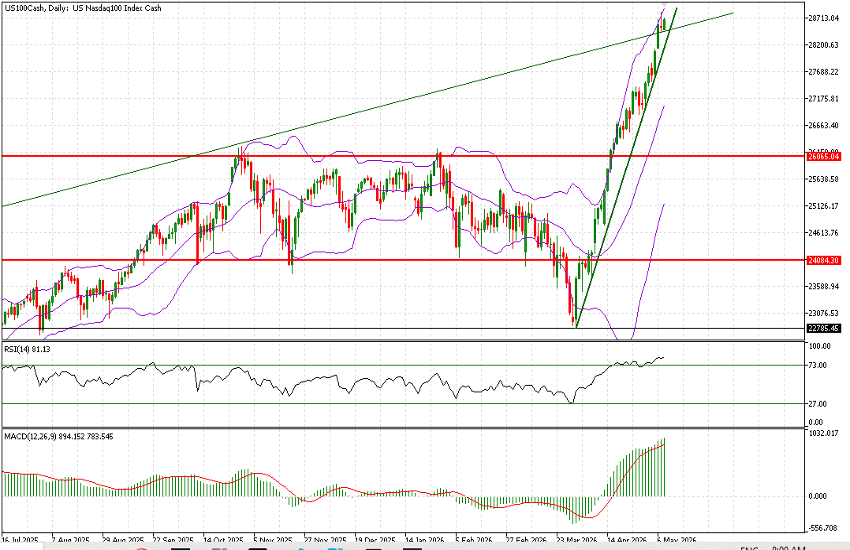
US100, Daily, Jul 2025 – Now
Momentum indicators remain heavily overbought, with the RSI trading above 81. The upper Bollinger Band has also been tested during the last two sessions, although this generally reflects underlying strength rather than immediate weakness.
The upward trendline extending from the left side of the chart is also particularly relevant, as it connects the major market highs of the bull cycle since 2022. Prices are currently trading directly against this trendline, slightly above it.
While market sentiment remains strongly bullish, caution may now be warranted when chasing the Nasdaq at current levels. Momentum is beginning to show early signs of exhaustion, despite continued support from strong earnings growth and optimistic business outlooks across major technology companies.
A consolidation phase therefore appears increasingly possible. The steepest upward trendline—currently near 28,200—acts as the first key support area, followed by additional static levels around 27,400, 26,950, and 26,425.
At this stage, a sharp V-shaped reversal still appears unlikely. However, the market may soon provide opportunities to re-enter the index at more attractive levels following a period of consolidation.


