

Gold is currently at a critical make-or-break juncture on the chart and, strictly from a technical analysis perspective, the setup is becoming increasingly important. Drawing a trendline from the highs reached on January 29 at $5,596.70—and extending it through the relative highs of early March and again on April 17—the line now intersects around $4,725. Overnight, gold reached a high of $4,720.90 and is currently trading near $4,695, roughly 0.65% below today’s highs.
As mentioned several times previously, the strongest correlation remains with long-term US real interest rates (10Y real yields). These peaked at around 2.127% at the end of March, coinciding with gold’s low on March 23 at $4,099, and have since declined to approximately 1.933%, while gold has rebounded significantly from those levels.
The situation is somewhat different for the nominal 10Y Treasury yield, which during the same period traded between 4.44% and 4.245%, before retesting its highs just a few days ago (May 4) and currently trading around 4.354%. This divergence between nominal and real yields is largely attributable to rising long-term inflation expectations—specifically the 10Y breakeven inflation rate, which has little to do with monthly or annual CPI readings.
Over the same period, breakeven inflation expectations increased from 2.30% to a peak of 2.50% on May 4. A 20bps move over a 10-year horizon is far from insignificant.
The evolution of this metric could become increasingly important in the coming months. It is worth noting, however, that over the last 20 years the 10Y breakeven rate has only rarely traded above 2.50%, occurring mainly in 2022 and during the 2004–2006 period—both episodes that preceded significant stress in equity markets.
Technical Analysis
The attached chart may appear somewhat crowded because, in addition to the standard 21-day and 50-day moving averages, we have also included the Ichimoku indicator. This serves two purposes.
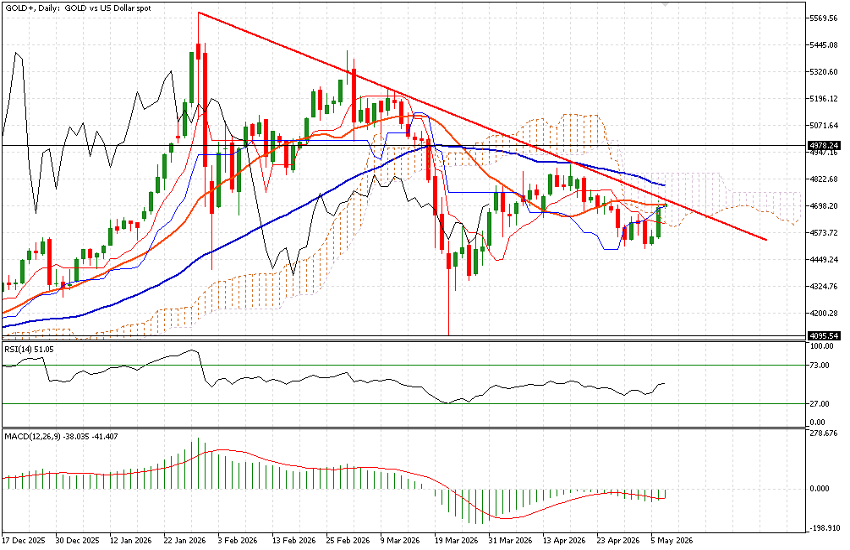
First, price is currently trading inside the Ichimoku cloud—typically a condition in which it is preferable to remain patient and wait for a decisive breakout before taking directional positions.
Second, the Chikou Span (the black lagging line) remains below the cloud, which still signals underlying weakness in the broader structure.
That said, price remains below both moving averages, which have now crossed bearishly, and is currently testing the 21-day moving average. The 50-day moving average sits slightly higher, around $4,790, above the descending trendline currently under observation.
As such, both the $4,725 trendline area and the $4,790 zone should be monitored closely, as a break above these levels could signal the end of the stronger bearish impulse. Beyond that, attention should shift toward the $4,860 and $4,900 resistance areas.
Conversely, should the descending trendline continue to hold, downside levels to monitor are $4,550 and then $4,500. As is often the case in gold markets, key support and resistance levels tend to cluster around round numbers.
The options market is currently pricing in a maximum move of approximately 1.3% by tomorrow. On the upside, this would imply a move toward $4,761—above the descending trendline but still below the slower moving average—while on the downside it points toward $4,639, slightly above last week’s highest closing levels around the $4,630 area.
For today, the preferred approach is to trade on shorter timeframes, using the daily 21-day moving average and descending trendline as primary reference points while maintaining relatively tight stop losses.
From a medium-term perspective, even in the event of an upside breakout, it may remain difficult for gold to move decisively outside the broader range that has defined recent trading activity—roughly between $4,500 and $4,900. These levels could therefore become attractive reference points for longer-term swing traders.


