

Conducting technical analysis on securities trading at all-time highs—or even multi-decade highs—is often challenging and, to some extent, of limited practical value. In such conditions, there is typically little to add beyond acknowledging that markets are in uncharted territory and that long positions should be allowed to run. Investors already positioned will tend to employ trailing stops—initially set wide enough to avoid premature exits—while those on the sidelines may look to very short-term moving averages (e.g., 5- or 8-day) as potential entry signals.
The broader backdrop is one in which multiple global indices are in similar territory. April proved to be a standout month: the Euro Stoxx 600 and Germany’s DAX recorded their strongest monthly performances of the year, while Japanese and Korean indices continued to push to fresh record highs. In the U.S., both the S&P 500 and Nasdaq posted their best monthly gains in six years—last seen in April 2020, when markets rebounded sharply following the initial COVID shock (+12.68% then versus +10.42% now).
Among the top performers—particularly within Europe—was Italy’s FTSE MIB, which advanced +8.88%, supported by strength across multiple sectors. Leading contributors included STMicroelectronics, benefiting from sustained momentum in the semiconductor space, particularly in automotive applications; Prysmian, driven by demand in telecommunications and energy infrastructure; and Brunello Cucinelli, with the luxury segment buoyed by expectations of geopolitical de-escalation. The energy sector also contributed, with ENI recovering earlier losses toward month-end as oil prices rebounded.
Notably, the FTSE MIB remains one of the few major indices still below its historical peak. In March 2000, shortly after the introduction of the euro, the index reached 50,109 points. Recalling such levels requires either long-standing market experience or access to extended historical data series.
TECHNICAL ANALYSIS
It was around the 21-day moving average that, last Thursday—the final trading session in Europe ahead of Labour Day—the ITA40 once again found support and resumed its upward move, after having reached a 26-year high just days earlier at 48,956. At the same time, the index was approaching the lower bound of the upward channel identified several months ago, which—after breaking down in early March—was reclaimed at the end of the same month, in line with what was observed across many other indices. The static support level at 46,950, near the lower end of the April 8 gap-up, also came into play (the April 29 low was 47,034).
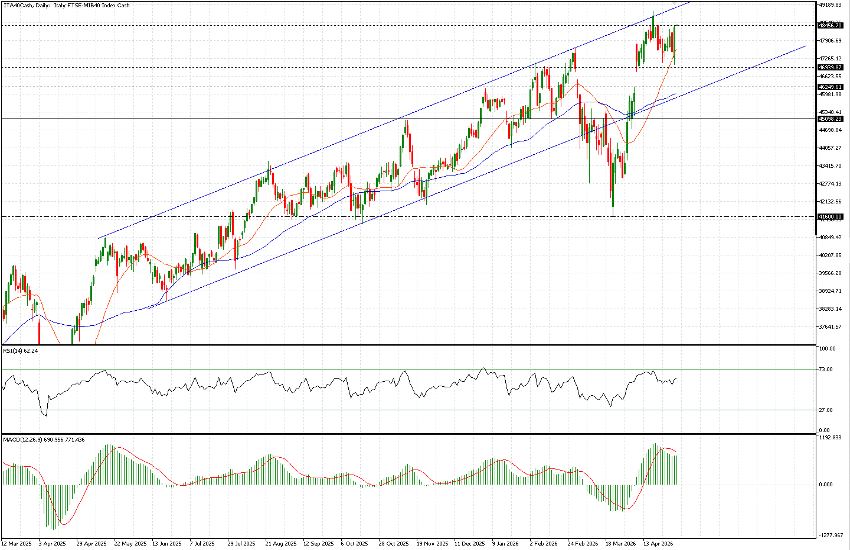
ITA40, Daily, Jan 2025 – Now
Momentum indicators remain positive and, considering Friday’s session in the U.S., it is reasonable to expect that upon reopening, the index will position itself very close to the highs recorded on April 17 (48,956) or the closing level (48,782). As noted earlier, all-time highs are now within reach and could represent the natural near-term target for the Italian index.
For completeness on the downside, initial support lies at 46,250, followed by 45,100. That said, given the current market tone, focusing on these levels may prove largely academic—at least until any materially market-moving developments return to the tape.


