SOXX Hits Record Streak as Intel Rallies

The SOXX, the Philadelphia Semiconductor Index and the main benchmark for the sector, rose again yesterday, marking its 17th consecutive session of gains. That alone is notable, but it also represents the longest winning streak ever recorded. Previously, the index reached 15 consecutive up sessions in late 2014, while historically it has tended to stall after 8 or 9 consecutive gains.
As expected, the chart has turned nearly vertical. The stock we focus on today shows a very similar pattern—almost identical over recent weeks. Intel has surged sharply. With a forward P/E of 94x, it now trades at the highest valuation multiple among index components, roughly five times its own 10-year average.

SOXX winning streak, Bloomberg, 23 Apr
In a landmark move last September, the Trump administration agreed to invest $8.9 billion in Intel common stock, becoming the company’s largest shareholder with an approximate 10% stake. The rationale was primarily geopolitical: competition with China, the race for artificial intelligence, and the push to strengthen domestic semiconductor production. Shortly thereafter, Nvidia acquired an approximate 4% stake in Intel, while SoftBank also invested. Combined, these transactions brought in roughly $20 billion in capital, used in part to reduce debt and strengthen the balance sheet.
The stock’s performance reflects a significant turnaround. Intel closed yesterday at approximately $66.78, up 278% from its 2024 lows, with a market capitalization exceeding $200 billion. Q1 2026 earnings exceeded expectations, with revenue rising more than 7%, suggesting a return to growth, supported in part by strong demand for server chips used in AI data centers.
Strategically, Intel is pursuing a dual path: competing in AI chips while expanding its foundry business to manufacture chips for third parties. The partnership with Nvidia—including the co-development of custom x86 CPUs for data centers—is seen as a potential catalyst that could validate Intel’s foundry ambitions and attract additional clients. Microsoft has reportedly already signed a deal with an estimated lifetime value of $15 billion.
TECHNICAL ANALYSIS
On the daily chart, the gap formed over the September 16–17 weekend—following the announcement of government and Nvidia involvement—remains clearly visible. Since then, the stock has advanced within a well-defined rising channel.
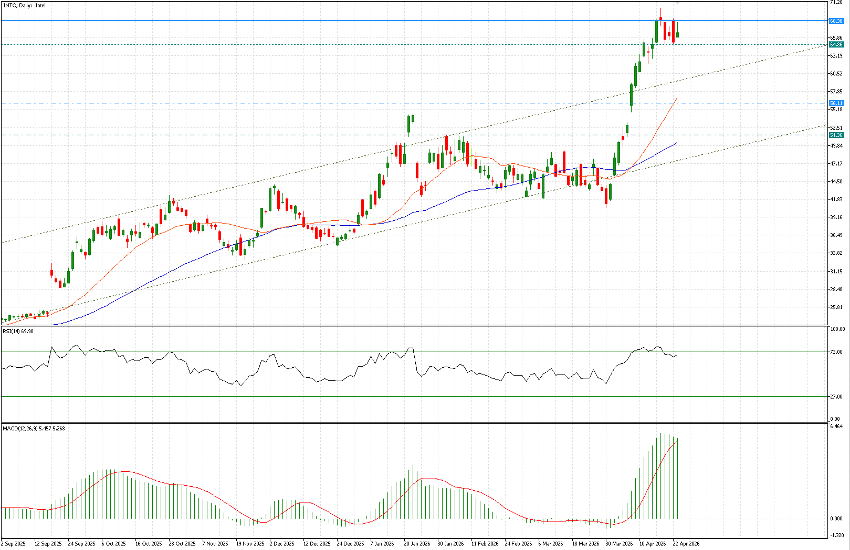
On January 21, an attempted breakout to the upside led to a brief acceleration, but the move faded within two sessions. On March 30, a downside break of the channel was attempted, but this also proved false, triggering the strong rally that followed. The low on March 30 was $40.58, while the high on April 17 reached $70.26—a gain of 73% over a short period.
The static levels on the chart correspond to support and resistance zones from 2021 and 2023, when the stock previously traded in these areas before reclaiming them.
The base-case scenario suggests that the stock may require a period of consolidation following such strong gains, potentially including a pullback. For a more sustainable continuation, price would likely need to return within the rising channel, currently between $47.75 and $59.50. This range also includes the 21-day and 50-day moving averages, now at $57.05 and $50.28.
At current levels, entering the stock implies paying a relatively elevated valuation compared to historical norms.