S&P 500 Rally: Tax Boost and Valuations

The recent rally that pushed the S&P 500 up 13.7% from the intraday lows of March 30 to the highs of April 17—over just 13 sessions—has one dominant explanation: the attempt to reach a diplomatic resolution to the current conflict and the resulting two-week ceasefire, which is set to expire tonight. Other explanations have also been suggested, including gamma hedging by options desks at major market makers, which may have forced them to buy underlying assets to rebalance exposure, though this remains a more technical factor.
Here, we focus on two additional drivers: the U.S. tax season, which ended on April 15, and valuations, as reflected in the current earnings season—now underway—and in analysts’ expectations.
The April Tax Deadline and the OBBBA
The One Big Beautiful Bill Act (signed in summer 2025) retroactively introduced new tax deductions for tips, overtime pay, auto loan interest, a higher child tax credit, and an increased SALT cap. As the IRS did not adjust withholding tables during 2025, taxpayers over-withheld throughout the year and are now receiving unusually large refunds, benefiting middle- and high-income consumers. The IRS has refunded more than $202 billion so far this filing season, with the average refund reaching $3,571.
These larger refunds are effectively functioning as a new round of stimulus, boosting consumer demand early in the year. If spent quickly, they could support both economic growth and above-trend inflation well into 2026. Increased household disposable income may, in turn, reinforce corporate earnings expectations—a key pillar of equity valuations.
US Earnings Season and Fundamental Ratios
Early results have been strong. At this stage, 88% of S&P 500 companies that have reported have beaten EPS estimates—above the 1-year average of 79%, the 5-year average of 78%, and the 10-year average of 76%. FactSet had forecast approximately 12.5% earnings growth for the S&P 500 in Q1 2026, marking a sixth consecutive quarter of double-digit growth.
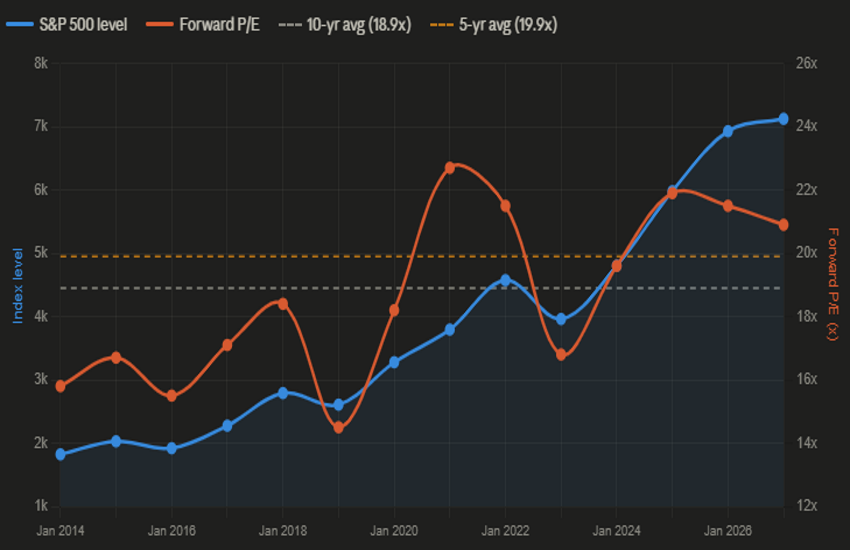
The forward 12-month P/E for the S&P 500 currently stands at 20.9x, above both the 5-year average of 19.9x and the 10-year average of 18.9x. For full-year 2026, analysts project earnings growth of 18%, with quarterly acceleration through the year: Q2 at 20.1%, Q3 at 22.2%, and Q4 at 19.9%. If these projections hold, the forward P/E would compress as earnings catch up with prices—the classic bull case.
The chart below combines the S&P 500 price (left axis) with its forward P/E (right axis). As the data are annual, the March decline is not reflected, with one additional data point included for April 1. Current forward estimate growth suggests the index appears fundamentally cheaper today than in January 2026, when it traded around 6,920 (approximately 200 points lower), and even more so compared to January 2025.
All of this, however, remains based on estimates. The market is pricing in an optimistic scenario where geopolitical risks remain contained and AI-driven productivity supports above-trend earnings growth. If guidance deteriorates as more results are released, this thesis will be tested. Notably, a meaningful share of companies are refraining from issuing clear forward guidance due to ongoing uncertainty—contrasting with analysts’ confidence and echoing last year’s tariff-related guidance withdrawals.