

A “regime change” appears to have emerged in recent months. In financial markets, this expression is used when a previously established behaviour, such as a correlation, stops materialising and strategies built around that relationship need to be reconsidered.
This article does not approach Bitcoin from a strongly pro-crypto perspective. However, for a long time, Bitcoin’s price action was widely used as a proxy for risk-on/risk-off sentiment. Bitcoin and the Nasdaq often moved in the same direction, and BTC frequently began the move slightly ahead of the index. At one point, some traders even described trading Bitcoin as trading a leveraged version of the U.S. technology index.
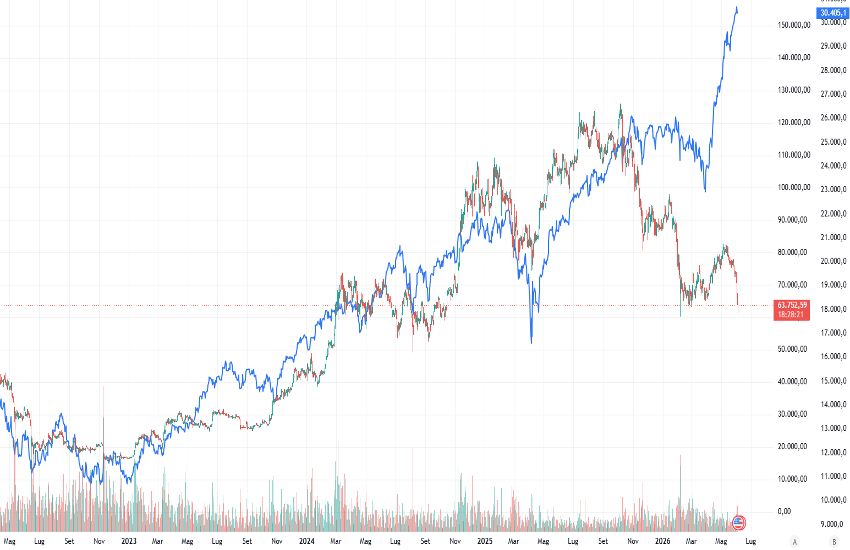
If the Nasdaq was flat and directionless while Bitcoin had already started moving higher, there was a reasonable probability that the technology index would soon break its stalemate to the upside. Bitcoin also traded over the weekend, often providing useful clues for Monday’s market open. In recent years, several platforms have emerged that price major instruments even during market holidays, but that is a separate discussion.
That correlation has weakened significantly over the last several months. Around the end of October last year, Bitcoin began a decisive decline after nearly reaching $126,000, while the Nasdaq never truly collapsed alongside the cryptocurrency. After a prolonged consolidation phase, the technology index resumed its advance with conviction. The performance gap between the two assets over this period is approximately 70%.
What could be causing Bitcoin’s underperformance? There are several hypotheses. One frequently cited explanation is the role of spot ETFs, finally approved by the SEC in January 2024. These products changed the market structure by requiring asset managers to hold actual Bitcoin. ETF investing naturally includes a significant institutional component alongside retail participation, and that institutional flow is increasingly influencing BTC’s price action. For the record, yesterday marked the tenth consecutive day of outflows from Bitcoin-related ETFs.
Another hypothesis is that investors now have access to a wider range of high-volatility instruments capable of generating large daily moves and attracting retail traders seeking quick profits. Examples include Bitcoin perpetual futures and 0DTE, or zero-days-to-expiration, options, which have become especially popular across U.S. markets.
Returning to the institutional angle, some observers believe liquidity is being directed not only toward the extraordinary AI-driven rally, but also toward several highly anticipated mega-IPO candidates, including SpaceX, OpenAI, and very likely Anthropic.
Whatever the reason, Bitcoin has been in a bear market for seven months and is currently trading roughly 50% below its peak, a decline that remains far from unusual by historical standards. Even Strategy, the company formerly known for its technology business and now effectively functioning as a Bitcoin vault while representing roughly three-quarters of institutional BTC holdings, sold Bitcoin for only the second time in its history last week. Its average acquisition cost is around $67,000, which is a particularly interesting figure.
Technical Analysis
From a technical perspective, $60,000 is the key line in the sand for Bitcoin. The encouraging point is that today, after falling as low as $61,341, it has rebounded toward $64,100 and is currently forming a hammer candlestick, although the trading session has only just begun.
The other major static level is $74,000, while $65,700 represents a secondary but nearby level that deserves close attention.
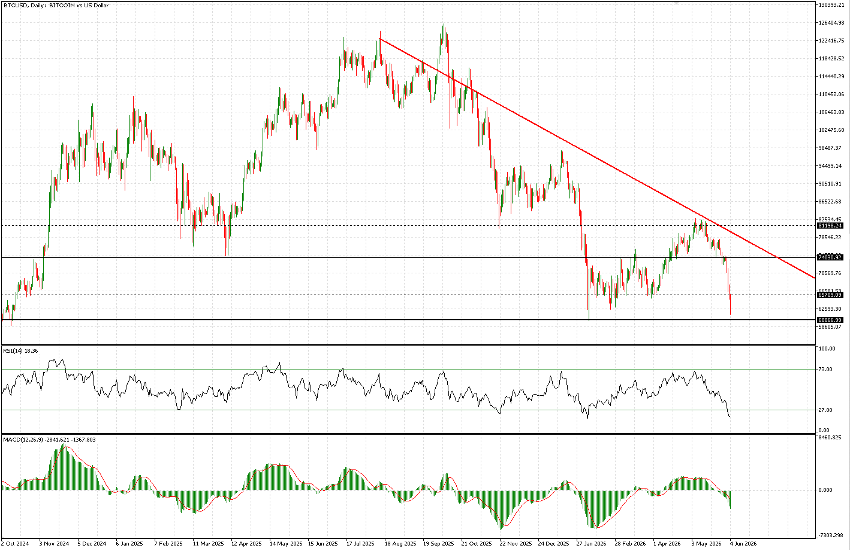
Price remains under pressure from a clearly defined downtrend. The latest leg lower began after a rejection from that trendline in mid-May around the $81,200 area, another zone of major technical significance.
As long as $60,000 holds, the outlook remains constructive for long-term holders. The RSI has also entered oversold territory, which could help limit further selling pressure in the near term. That said, both the downtrend and the resistance levels mentioned above remain significant obstacles, suggesting that any rebound may initially be capped at roughly 15%–20% from current levels.
We would nevertheless remain cautious about becoming outright bullish. There has not yet been a clear capitulation event, and although Bitcoin is now approaching a 50% drawdown from its highs, history shows that much deeper declines are possible. Bitcoin has previously endured drawdowns of 93% in 2011, 84% in 2017–2018, and 77% in 2021–2022, with the latter two occurring when the world’s largest cryptocurrency was already a far more mature asset.

