



UK Brent crude has returned to levels close to where it traded before the outbreak of conflict in the Middle East. Brent closed at $73.52 on February 27, compared with its current price of $76.70, leaving a difference of just 4.3%. This marks a sharp reversal from the escalation period, when prices surged as high as $120.
The latest developments have added further pressure to oil prices. More than 11,000 seafarers stranded in the Persian Gulf are expected to begin transiting through the Strait of Hormuz after safety guarantees were secured. The operation will be carried out in close cooperation with Iran, Oman, other coastal states in the region, the United States, and the maritime industry.
This is another positive development for oil prices and global inflation expectations. In addition, the U.S. Senate approved an official resolution calling for an end to the conflict in Iran. The practical and legal implications of this resolution remain to be seen.
The 10-year breakeven inflation rate, which reflects the market’s long-term inflation expectations, has fallen sharply from 2.50% to 2.20% over the past month. This move has also been reflected in a surge in real yields, which have risen much more strongly than nominal yields.
Real rates remain one of the main headwinds for precious metals and help explain the pressure seen across the sector in recent sessions. The strength of the U.S. dollar has added to this trend, with the DXY now trading at its highest level in a year. This reflects a classic transmission mechanism linking oil, inflation expectations, real yields, the U.S. dollar, and broader asset classes.
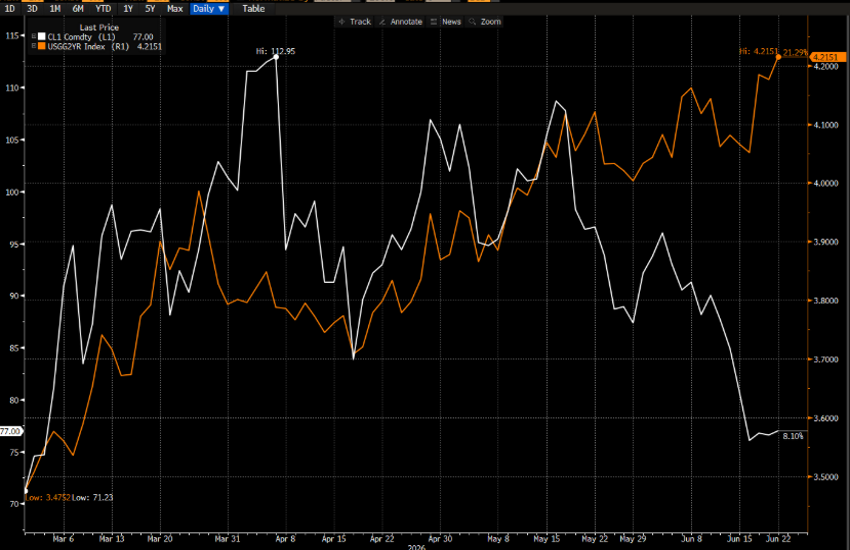
One notable market development is the shift in correlations. U.S. short-term interest rates and oil prices were almost perfectly correlated from March until mid-May, as higher oil prices implied higher inflation and higher interest rates. That relationship has now almost completely decoupled.
Technical Analysis
The decline in Brent crude began on May 5 from just above $119. Since then, prices have fallen by more than $40, or over 35%, in just 38 trading sessions.
The first key level to break was $94.91, which gave way on June 11 with a long bearish Marubozu candle. This was followed by a break below $87.60, which was left behind after a gap lower on June 15.
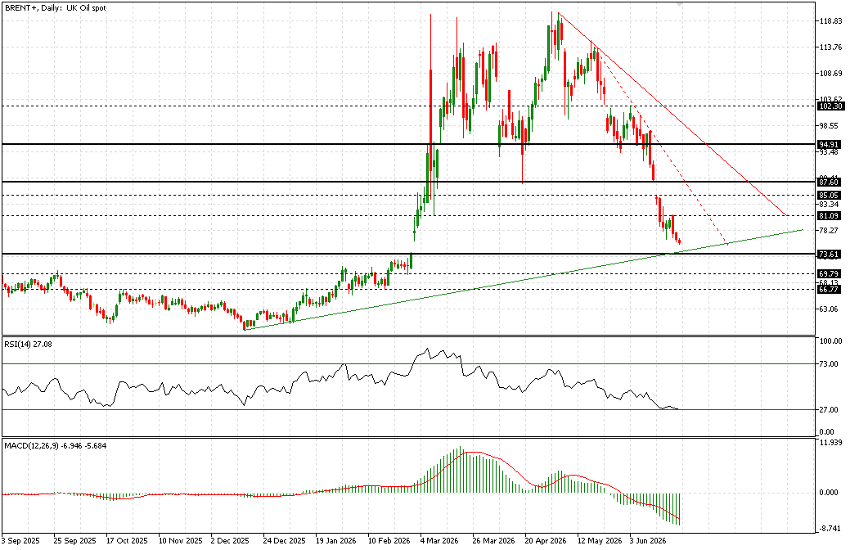
The $73.50 area now sits not far below current levels. This marks the last closing price before the outbreak of the war. It also coincides with a weak ascending trendline that began during the modest recovery in late December 2025.
On the downside, two bearish trendlines remain in focus. The steeper trendline, which originated on May 19 and has already been confirmed three times earlier this month, remains well above the current market price. It will become relevant again if oil stages a rebound.
For now, the decline remains active, and attempting to catch the falling move may not be the strongest strategy. Technical indicators remain weak, although they are not yet deeply oversold. A move toward $73.50 appears plausible. A decisive break below this support could open the door to a further decline toward $69.80, even if that scenario is more difficult to justify from a fundamental perspective.
On the upside, the key levels to watch are $78, followed by $81.10 and $85. Above these thresholds, the previously identified bearish trendlines would come back into focus.


