

Over the past several weeks, we have repeatedly discussed the powerful rally in precious metals. It was hard to ignore: silver had risen by +69.66% in just one month, up to Thursday, January 29. The move appeared unstoppable and—frankly—illogical, difficult to justify on fundamental grounds, and above all imprudent. Plausible explanations did exist: silver’s growing use as a heat-dissipation material in data centers, a structural production deficit, and China’s export ban following the metal’s designation as “strategic” by the United States in November. Still, none of these factors fully explained a move of such speed and magnitude.
Then, on Friday, January 30, the market experienced one of the largest single-day declines in history. Silver suffered what quantitative analysts describe as a “10-sigma event” placing it among the five most severe market crashes of the past century. Prices fell by -27.53%, or $32.38, from an opening level of $117.63, wiping out approximately $1.5 trillion in market capitalization. It was, by any definition, a day of reckoning—an outright market armageddon.
The causes were likely multiple. Some pointed to the change in central bank leadership and the appointment of Warsh, though this explanation appears unconvincing. More credibly, margin requirements imposed by the CME had already risen by roughly 20% in recent weeks and were increased sharply again on Friday. Speculative positioning also played a decisive role, as many funds—hedge and otherwise—that had entered to ride the parabolic move were forced to unwind positions, possibly under margin pressure, once the selloff began.
Perhaps the most striking fact is that even after Friday’s collapse, silver remains the best-performing major asset year to date, still up 18.87%.
As noted previously, this was not the largest crash in silver’s history, but the second-largest. The most severe occurred during “Silver Thursday” in 1980, closely tied to the Hunt brothers’ attempt to dominate attempt the market amid the inflationary turmoil of the late 1970s. Seeking protection from a weakening dollar and rising inflation, Nelson Bunker Hunt and William Herbert Hunt accumulated massive amounts of physical silver and leveraged futures positions, eventually controlling a significant share of global supply. Their buying helped drive silver from under $10 per ounce in 1979 to nearly $50 by January 1980.
The reversal began when exchanges imposed liquidation-only rules and sharply increased margin requirements to curb concentration risk. These changes exposed the Hunts’ heavy reliance on leverage, triggering margin calls they could not meet. On March 27, 1980—Silver Thursday—prices collapsed by 33% in a rapid selloff, erasing much of the rally and forcing widespread liquidation. Another extreme episode followed in 2011, once again linked to aggressive margin hikes—five increases in one week—which led to a rapid 12% decline.
TECHNICAL ANALYSIS
On Friday, silver found support near $73.80, corresponding to its 50-day moving average (MA50). The session closed at $85.27 slightly below the upward trendline that began in November and accelerated sharply earlier this year. From a technical perspective, this suggests that in the coming sessions silver may attempt to defend that trendline -potentially rebounding toward the 21-day moving average (MA21), currently around $91.80 but also that the same trendline is now potentially acting as resistance.
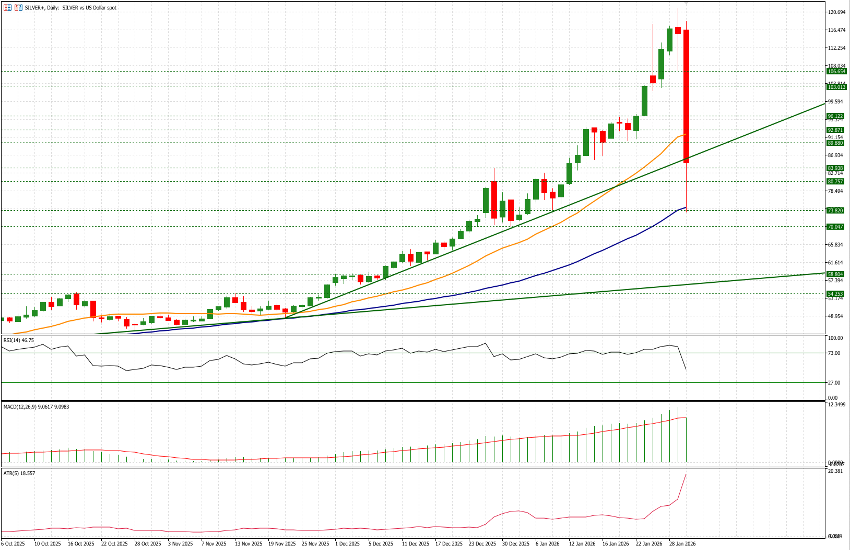
On the upside, key resistance levels to monitor are $87.90, $89.90, $92.85, and $96.15. On the downside, attention should be paid to $84.00, $80.75, and the $73.80 area. Volatility is expected to remain extreme; as such, trading in this environment is suitable only for high-risk profiles and short-term, intraday strategies. Over the past five sessions, the rolling average daily range has been $18.56, underscoring the unusually elevated volatility regime.


