

Charts provide nearly all the information needed to analyse the price action of a financial instrument. In practice, charts are generated directly from a stream of numerical price data.
One basic way to inspect this data is by using the Crosshair tool (CTRL+F). By positioning it over a specific candle, you can estimate the low, high, close, and other values directly from the y-axis. A more precise method, however, is to use the Data Window module (CTRL+D or View → Data Window). This opens a panel on the right side of the platform displaying the exact values of the selected candle, including all indicator readings corresponding to that specific point in time.
In many situations, however, there is a more efficient way to work with price data: viewing it in a table format similar to a spreadsheet. MetaTrader 5 provides this functionality and also allows users to export the data outside the platform.
This is particularly valuable because high-quality historical market data is often expensive. Public sources such as Yahoo Finance typically provide only limited historical coverage and mostly daily data. MT5, by contrast, can provide highly granular historical data — including tick-level data — spanning years or even decades directly through the trading platform.
This functionality has many practical applications. In this article, we will focus on two:
- Order execution and slippage verification
- Data analysis and market research using exported datasets
Before exploring these examples, it is important to understand how to access the data.
Accessing the Symbols Module
There are three ways to open the Symbols module in MT5:
- Right-click inside the Watchlist and select “Symbols”
- Use the Symbols icon in the top toolbar
- Navigate through Menu → View → Symbols
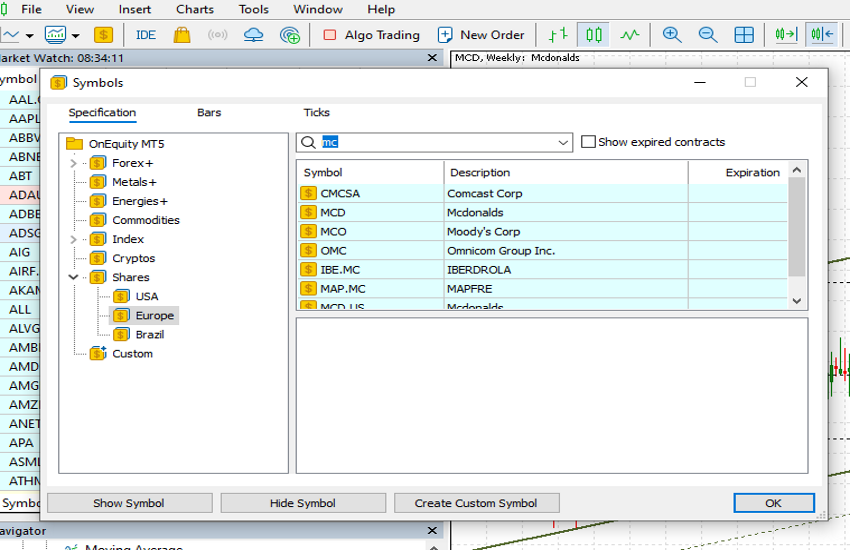
Once opened, the module displays three main sections at the top:
- Specification
- Bars
- Ticks
The module opens by default in the Specification tab. On the left side, users can browse Asset Classes and expand them to locate specific instruments. Alternatively, the Search field in the top-right corner can be used to find instruments directly.
After selecting an instrument, MT5 displays its specifications, including:
- Currency
- Spread
- Margin
- Trading hours
- Contract information
The sections most relevant for data extraction are Bars and Ticks.
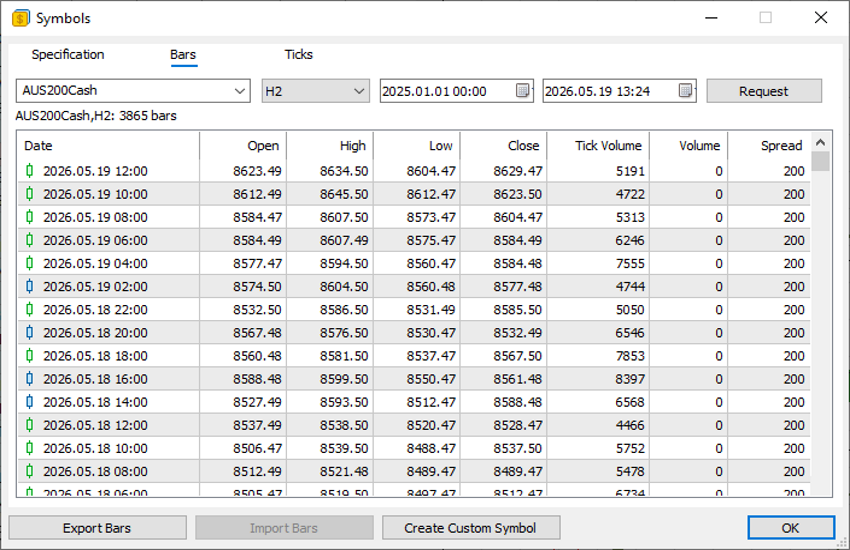
Bars and Tick Data
Inside the Bars section, users can select:
- Timeframe (M1, H1, Daily, etc.)
- Start date
- End date
By clicking Request, MT5 retrieves all corresponding historical data, including volume and spread information. The dataset can then be exported in CSV format using the Export Bars button.
The Ticks section works similarly but retrieves every individual market tick recorded during the selected period. Tick data is significantly more granular and can become extremely large, especially during periods of high trading activity where hundreds of ticks may occur within a single second.
Order Execution and Slippage Verification
One practical use of this functionality is order execution verification.
Suppose a trader believes a market order was executed at an incorrect price. Before contacting customer support, the exact market conditions can be reviewed directly through the exported data.
For example, during major economic releases, volatility can spike sharply within milliseconds. By reviewing tick data, traders may notice that prices moved significantly higher or lower during execution, explaining the final fill price. It is also important to remember that buy orders execute at the Ask price, while sell orders execute at the Bid price.
Similarly, traders using limit orders may discover that although the trigger price was reached, the next available tick occurred at a different level, preventing execution at the requested price. This reflects normal market mechanics rather than a platform issue.
In rare cases, the data may instead reveal an actual execution anomaly. If so, traders can contact their account manager or customer support with precise timestamps and evidence.
Data Export and Research
The ability to export market data into external applications is particularly useful for research and strategy development.
CSV files can easily be analysed in Excel, while more advanced users may prefer programming languages such as Python for statistical analysis and model development.
The possibilities are extensive. Traders may wish to:
- Analyse hourly percentage changes
- Measure volatility distributions
- Study price behaviour following major moves
- Develop custom indicators
- Build statistical trading models
Another useful application is creating derived instruments for comparative analysis. For example, traders could export historical Gold and Silver prices and calculate the Gold/Silver ratio by dividing Gold closing prices by Silver closing prices. This may help identify relative overvaluation or undervaluation between the two metals.
MT5’s built-in data tools therefore provide not only execution transparency but also a foundation for deeper quantitative market analysis.

