



Gold remains technically fragile after failing to reclaim the key $4,365 resistance level. The previous swing low around $4,100, established on March 23, has held for now, allowing prices to rebound, but the move has been decisively rejected at resistance. This morning, gold is trading at $4,144, down 1.67%.
The evolution of long-dated U.S. Treasury yields and the U.S. dollar following Kevin Warsh’s first FOMC meeting has undoubtedly contributed to the move. It is also worth noting that the DXY has broken above the 100.30 area, which had acted as the upper boundary of its long-term trading range for roughly a year. Momentum indicators are not yet overstretched, suggesting there is still scope for the rally to extend toward the 101.60 region.
Silver, the second most widely followed precious metal, is also exhibiting an increasingly bearish technical configuration. The triangular consolidation that developed following the boom-and-bust cycle between January and February 2026 broke to the downside on June 5, sending prices below the key $74 threshold.
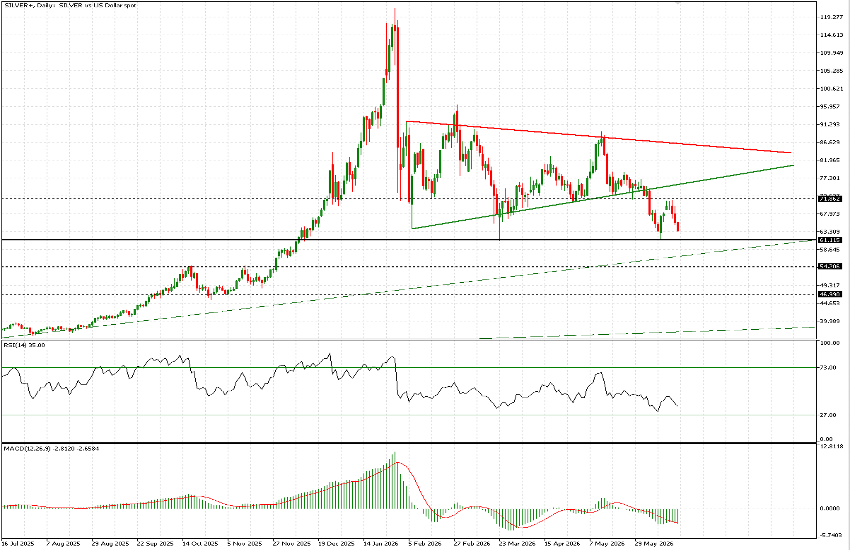
From there, the metal declined to retest the March 23 swing low near $61 before staging a modest rebound toward resistance at $71.85. While the move originated from what could have developed into a double-bottom formation, the pattern was never confirmed. The $71.85 level now serves a similar role for silver as $4,365 does for gold.
This morning, silver is down 2.96% and is currently trading at $63.78. The RSI stands at 35.33 and continues to point lower, while the MACD remains firmly in negative territory.
The technical picture suggests another test of the $61 support level within the coming weeks, which would represent a distinctly bearish development. A decisive break below that floor would expose the $54.20 area, with potential intermediate support levels around $58.80 and $56.50. Should downside momentum accelerate further, a move toward $47 cannot be ruled out, although that scenario remains some distance away at this stage.
The dashed line shown on the chart represents a relatively weak ascending trendline that originated in April 2025 and was only validated in August of the same year. It is unlikely to provide meaningful support in the event of renewed selling pressure. By contrast, a far more credible long-term uptrend line currently lies below the $40 mark.
In summary, the technical outlook for silver remains cautious. A retest of the $61 support level appears increasingly likely, with a break below that threshold exposing further downside risk.


