



Several European indices have started the year at unprecedented levels. Spain’s IBEX 35 has surged to 17,620, the pan-European Euro Stoxx has climbed to 5,938, and Germany’s DAX is now trading around 24,960. The French CAC 40 is also very close to a bullish breakout. To this list we should add Italy’s FTSE MIB, which, due to its subdued performance over the past 20 years, has not yet revisited the levels reached in 2000, near the 50,000 area.
That said, there is a specific short-term technical signal that warrants attention, particularly evident on the German index. The DAX has now recorded two consecutive sessions trading outside the Bollinger Bands. This indicator, which is based on a moving average, defines levels corresponding to two standard deviations above and below the mean. From a statistical standpoint, assuming a normal distribution, approximately 96% of observations should fall within these boundaries.
Naturally, this framework relies on several approximations. First, it is not prices themselves that follow a normal distribution, but rather daily percentage changes. Second, even those returns rarely conform perfectly to a normal distribution, with quantitative traders more often modeling them as log-normal. Nevertheless, the Bollinger Bands indicator has proven to be reasonably effective and is widely used in practice.
In trending markets, “hugging the bands” often signal trend continuation. However, there is a specific configuration that more commonly marks the exhaustion of a move—or, if not an outright reversal, at least a temporary pause. This typically occurs when one of the two bands is decisively breached and prices begin trading outside it.
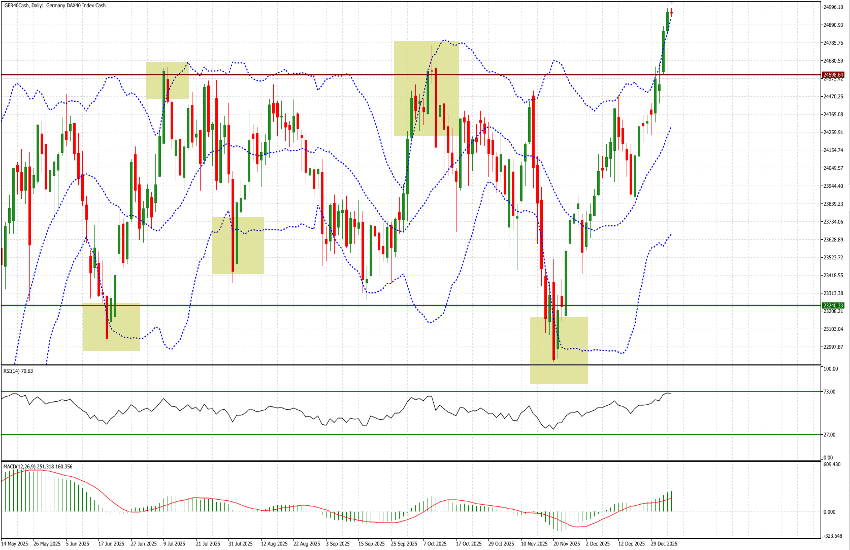
On the DAX, this pattern is particularly clear. On Monday, January 5, a low-volume session pushed prices well above the upper Bollinger Band. Yesterday, rather than reverting back inside the bands, prices continued to advance. This morning, the same dynamic is unfolding: prices have not even approached the upper band. A similar, though less pronounced, phenomenon can also be observed on the FTSE MIB and the IBEX.
A review of recent months on the German index highlights the reliability of this signal. The Bollinger Bands were breached on June 19, July 9, August 1, and November 20, each time followed by a reversal. Only the October 2 breakout resulted in a brief consolidation lasting several days before prices resumed their decline; even in that instance, the breach occurred to the upside. This supports the view that the signal carries a high statistical probability, while acknowledging—as with all technical indicators—that it is not infallible.
When this evidence is combined with a relatively elevated RSI reading, currently around 70.73, it suggests prudence in adding to long positions at current levels. Exercising patience and waiting for a retest of previously broken highs—specifically 24,770 and, more importantly, 24,600—may represent a more disciplined and prudent strategy.


