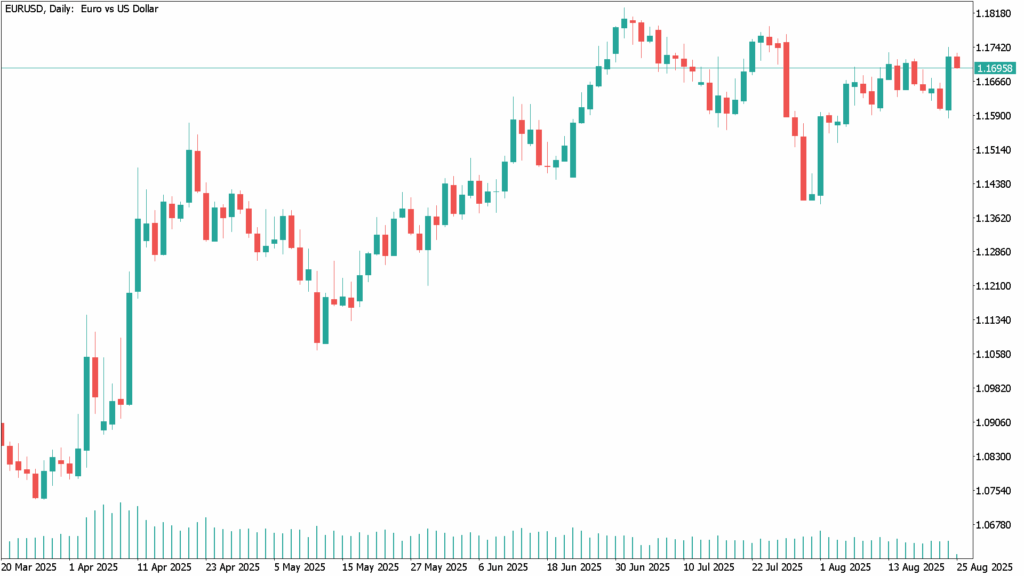
EUR/USD eased on Monday, trading near 1.1700 after advancing around 1% in the previous session. Losses, however, may remain limited as the U.S. Dollar (USD) continues to face pressure from rising expectations of a Federal Reserve (Fed) rate cut in September, following Chair Jerome Powell’s remarks at the Jackson Hole Symposium.
Powell acknowledged increasing risks to the labor market while reiterating that inflation remains a concern, stressing that no policy decision has yet been finalized. He also noted that the Fed may not need to tighten further, given the uncertain estimates that employment could still be running above its sustainable level.
According to the CME FedWatch Tool, markets now assign nearly an 85% probability of a 25 bps rate cut in September, up from 75% before Powell’s comments. Attention now turns to Friday’s releases of Q2 U.S. GDP (annualized) and July PCE Price Index data, the Fed’s preferred measure of inflation.
From Europe, ECB Governing Council member Joachim Nagel stated that rate cuts would only be considered if there is a material deterioration in the economic outlook, while fellow policymaker Martins Kazaks signaled that the ECB has entered a new phase focused on monitoring the economy rather than active intervention, according to Bloomberg.
EUR/USD Daily Technical Analysis – August 25
The daily chart for EUR/USD remains constructive. Technical indicators are recovering from midline levels, maintaining upward slopes. Buyers continue to defend the downside around the mildly bearish 20-day SMA at 1.1610, while the bullish 100-day SMA offers stronger support at 1.1480.
Resistance is currently seen at 1.1730, where the pair has stalled for a second consecutive week. A decisive break above this level would open the door toward the yearly high at 1.1830, with further gains potentially targeting the 1.1900 threshold. On the downside, initial support lies at 1.1650, followed by 1.1590.