

European indices are outperforming U.S. ones this year, with several of them clearly above their previous all-time highs and pushing toward new records.
Possible reasons include a geographic rotation by large institutional investors, who are pulling capital out of the fatigued overseas technology trade and reallocating it to the Old Continent; a more accommodative monetary policy stance, likely with further room for action given that inflation is now below the European Central Bank (ECB) target—at least in its headline component—and the compression of spreads.
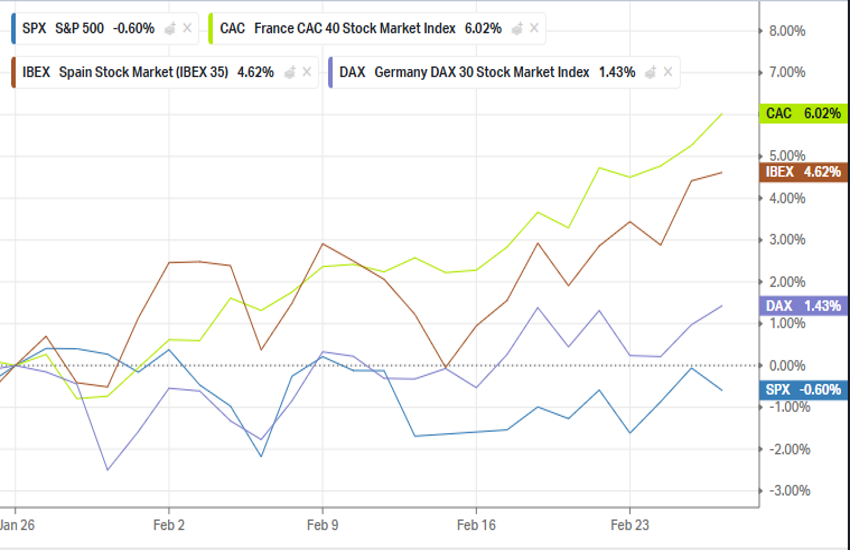
When discussing spreads, two main factors are generally considered. The first is the credit spread, meaning the additional cost large corporations pay to raise funds in the bond market; when this narrows, it can make them significantly more competitive and financially sound. The second is the more widely known sovereign spread—the yield differential between government bonds and the benchmark, which in Europe is Germany. Most countries are seeing these spreads decline significantly, including Spain, which benefits from strong fiscal fundamentals and an improving ratings outlook and is now only 53 basis points away from the German Bund, and France, which has seen its borrowing cost through its OATs fall from 72 to 57 basis points of spread over the past year, also following the formal approv.al of the 2026 budget.
Whatever the underlying reason, European index performance improves as one moves away from the core, and in 2026 it is clearly stronger than that of their U.S. peers.
TECHNICAL ANALYSIS
The French CAC 40, up 5.78% YTD as of yesterday’s close, began a new bullish impulse on January 28 after building a base and forming higher lows off the January 20–21 lows. Thanks to this move, it broke above the previous highs around 8,293—levels that had already been briefly exceeded at the beginning of the year before a correction followed.
On this 1-hour chart, we have framed price action within a channel, and price is currently trading above the “cleaner” upper boundary. Previously—on February 11—the price had briefly traded above it, but the current move appears more sustained and extended. That said, this calls for caution when considering a potential long entry.
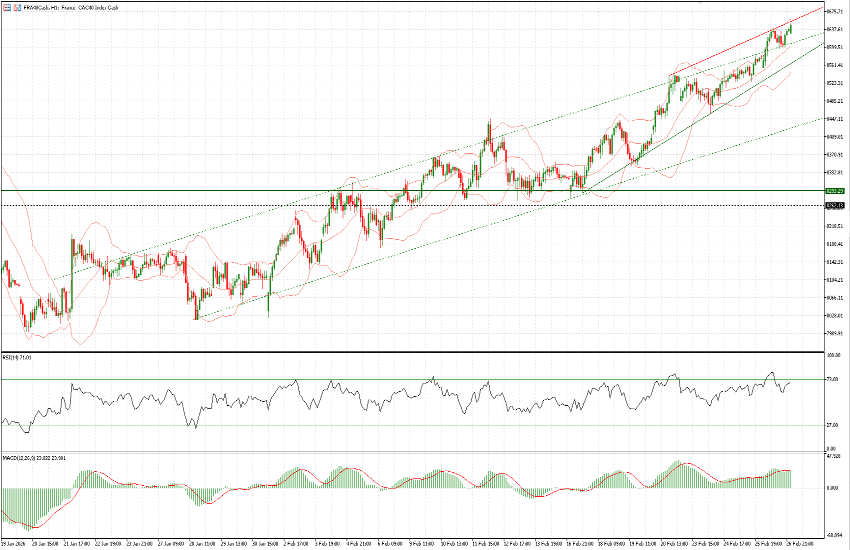
The 1-hour indicators are constructive: they are trending higher and not overbought, and the Bollinger Bands leave room for further extension. By connecting the last two highs from February 20 and yesterday, there appears to be room for a move toward 8,655–8,660 today (yesterday’s close: 8,620).
However, the daily RSI stands at 72—a relatively elevated reading. In general, it may be imprudent to initiate longs above the upper boundary of a clearly defined channel. In the event of a pullback, initial levels to monitor would be 8,600, followed by 8,580, 8,555, and then 8,525 and 8,485 as more significant support zones.
Those already positioned should allow profits to run, potentially using trailing stops, while noting that the daily ATR (5) indicates an average range of approximately 66 points per session for the index.


