



Brent crude prices rebounded sharply this week as renewed geopolitical tensions in the Strait of Hormuz reignited concerns over global oil supply.
On Tuesday, Brent crude futures settled 3% higher at $74.16 per barrel, while WTI gained 2.8% to $70.44 after Iran struck a Qatari LNG carrier and other vessels near the Strait of Hormuz. After the close, prices extended gains when the United States revoked Iran’s license to sell its oil. Brent surged 5.6% to $76.04, while WTI climbed 5.4% to $72.25 in after-hours trading.
The rally continued into Wednesday following fresh U.S. retaliatory strikes. Bloomberg described the escalation as the largest day of attacks in the Strait of Hormuz since the U.S.-Iran peace agreement, while the Associated Press reported the highest number of tanker strikes in a single day since late April, citing the UN’s International Maritime Organization. The sharp reversal comes after crude prices had recently drifted toward four month lows as Gulf supply recovered.
That recovery is now under renewed pressure. Before the latest escalation, oil flows through the Strait of Hormuz had been gradually normalising. The UAE increased crude production above 3.8 million barrels per day in June, its highest level since April 2020 and above pre conflict levels. OPEC+ continued raising production quotas, while reports indicated that Japan linked supertankers had resumed transits through the strait.
However, shipping activity remained below normal. By early July, one tracking provider estimated daily transits at roughly one quarter of pre conflict levels. War risk insurance premiums remained elevated, and many major carriers continued rerouting vessels around the Cape of Good Hope instead of using Hormuz.
According to CENTCOM, overnight strikes targeted more than 80 Iranian military assets, including air defence systems, command and control networks, coastal radar installations, anti ship missile sites, and more than 60 IRGC small boats operating in and around the strait. Explosions were reported in Bandar Abbas, Sirik, and Qeshm Island, with several injuries reported from shrapnel.
Iranian Parliament Speaker Mohammad Bagher Ghalibaf accused Washington of violating the memorandum of understanding and warned that “the era of bullying and extortion is over,” highlighting the growing strain on the June ceasefire and the renewed uncertainty facing global oil markets.
Technical Analysis
After peaking at $120.50 on our platform on April 30, UK Oil retraced to $70.15 by July 2, representing a 41.8% decline over 38 trading sessions.
The decline pushed the benchmark below its February 27 close at $73.52 and completed a textbook retest of the long term descending trendline that had been decisively broken at the start of the conflict.
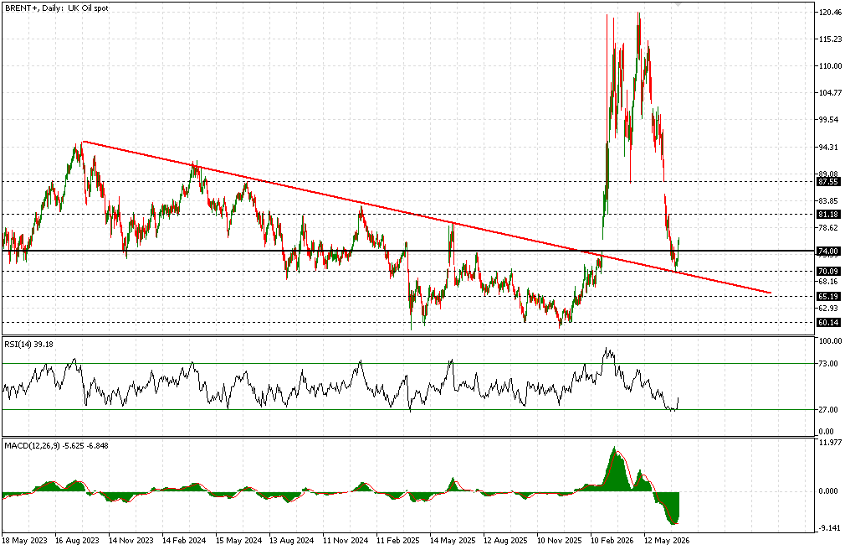
Yesterday’s rally lifted prices back above both the trendline resistance and the $74 level, which marked the late February high. Both the RSI and MACD have started recovering from oversold conditions. While the MACD remains in negative territory, it has produced a bullish crossover. Trading volume also reached its highest level since May 7, when UK Oil closed just below $100 before accelerating its decline during the following month.
From a broader technical perspective, key resistance levels are located at $81.20 and $87.50. Initial support is seen at $70, followed by the $65 region.
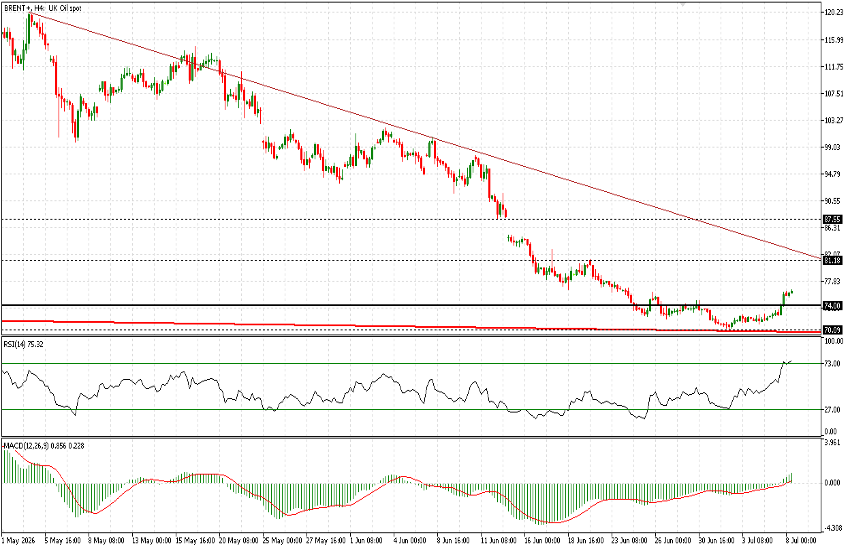
On the 4 hour chart, two technical features stand out. The first is the descending trendline that has guided prices lower since May, currently positioned near $82.60. The second is the RSI, which has already moved above the 70 level, signalling short term overbought conditions.
The current rally appears fundamentally supported by ongoing geopolitical developments, making the $81.20 area the first significant upside target. Whether prices can sustain a break above this level should become clearer over the coming sessions.
However, the overbought readings on shorter timeframes, together with the magnitude of yesterday’s advance, suggest the market could enter a brief consolidation phase before extending higher. Such a pause could see prices retest the $74 area from the current level of $76.22. Even so, the broader technical picture does not currently favour aggressive selling or another significant downside move.


