


Gold prices tumbled toward $4,100 during early Asian trading on Thursday, October 15, as stronger-than-expected US inflation data boosted expectations that the Federal Reserve could raise interest rates again. The latest CPI figures strengthened the case for tighter monetary policy, putting pressure on the non-yielding precious metal as investors reassessed the outlook for US interest rates.
Market attention is shifting to the US September PPI, Retail Sales, and Philadelphia Fed Manufacturing Survey, which could influence the US dollar, Treasury yields, and gold prices.
US headline CPI rose 3.7% year over year in September, exceeding expectations of 3.6%, while core CPI increased to 2.6% from 2.4%. The hotter inflation data has strengthened expectations of further Federal Reserve tightening, weighing on gold as higher interest rates increase the opportunity cost of holding non-yielding assets.
TD Securities reported increased CTA selling following the inflation surprise, with resistance near $4,200 per ounce. However, buying flows could provide support between $4,000 and $4,100. Meanwhile, San Francisco Fed President Mary Daly emphasized a cautious, data-dependent approach to persistent inflation, leaving further rate hikes possible if price pressures remain elevated.
For gold traders, the central question is whether the latest inflation figures mark a sustained shift toward tighter monetary policy or a temporary setback for the metal’s broader price trend.
Technical Analysis
Gold (XAU/USD) trades around $4,144 on October 15, attempting to recover from recent losses. However, the short-term outlook remains bearish as prices stay below the descending trendline.
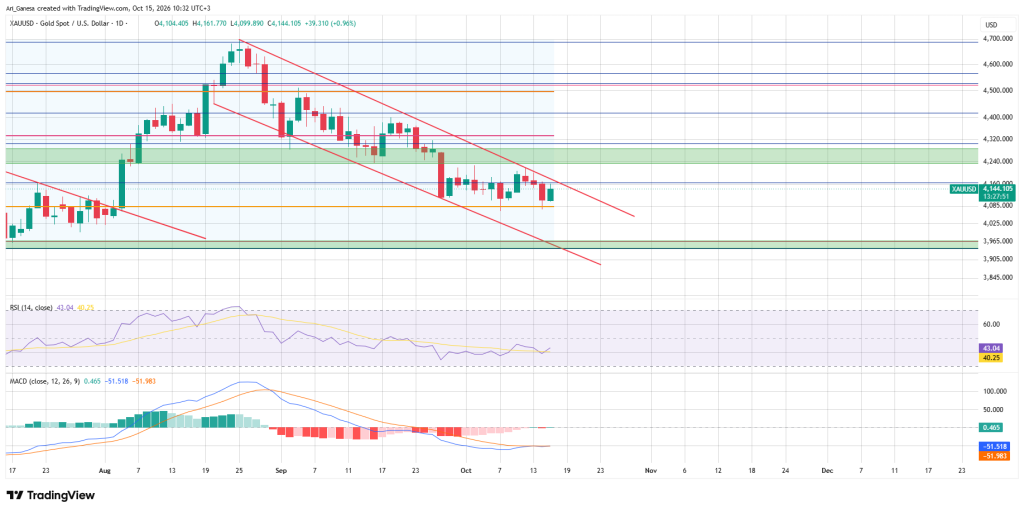
The Relative Strength Index (RSI) stands at 43.04, below the neutral 50 level, while the slightly positive MACD histogram at 0.465 suggests bearish momentum is easing. Nevertheless, both MACD lines remain below zero, leaving the recovery without clear bullish confirmation.
Support lies at 4,085–4,100, followed by $4,000 and 3,945–3,965. Resistance is positioned at 4,160–4,180, with a stronger barrier at 4,240–4,250. A break below support could extend losses, while a sustained move above the upper resistance zone and descending trendline would strengthen the bullish reversal case.
Traders should monitor these levels alongside US economic data, Federal Reserve rate expectations, and US dollar movements. Until a breakout confirms a directional shift, the rebound remains a potential correction within the broader bearish structure.