



The Dow Jones Industrial Average closed at 53,981.41 on Tuesday, August 11, down 60.99 points, or 0.11%. The index opened at 54,078.41 and traded as high as 54,078.41 before falling to an intraday low of 53,855.39.
Despite the geopolitical uncertainty, the technical structure of the Dow remains bullish. The index has recovered strongly from its recent low near 51,556 and continues to trade within an ascending trend structure.
DJI is currently trading around 53,981, just below the 23.6% Fibonacci retracement at 53,995.85. This level is particularly important because it sits almost exactly at the psychological 54,000 threshold.
The latest candles show some hesitation after the index moved above the 53,995 Fibonacci level. A confirmed daily close above 54,000 would strengthen the bullish setup and could expose the next major resistance at 54,749.47.
However, repeated rejection around 54,000 could encourage short-term profit-taking, particularly if geopolitical headlines continue to pressure broader risk sentiment.
Technical Analysis
The Fibonacci retracement highlights several key levels for DJI. The first major support is at 53,529.63, corresponding to the 38.2% Fibonacci level, followed by 53,152.81 at 50%. A deeper correction could bring the index toward 52,776.09 at 61.8%, with 52,648.37 and 52,239.53 as additional support levels. The recent swing low around 51,556 remains the major structural support. As long as these levels hold, the broader bullish structure remains intact.
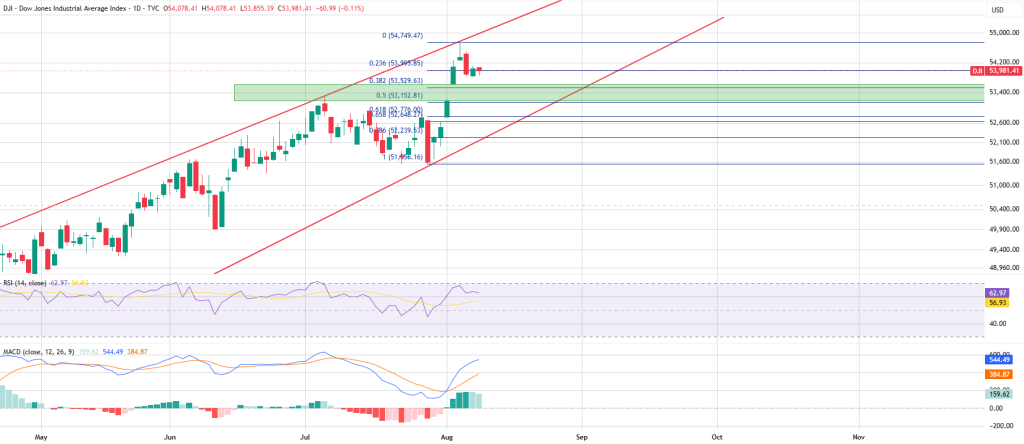
The RSI (14) stands at 62.97, with its moving average at 56.93. Remaining above 50 indicates that bullish momentum is still dominant, while the reading below 70 suggests DJI has not yet entered overbought territory. This leaves room for further upside, although traders should watch for bearish divergence if price reaches a new high without confirmation from RSI.
The MACD also supports the bullish outlook, with the MACD line at 544.49 above the signal line at 384.87 and a positive histogram of 159.62. The bullish crossover indicates that upside momentum is rebuilding. As long as MACD remains above the signal line, the momentum bias stays positive, while a bearish crossover could signal weakening momentum.
Tuesday’s session is important because DJI is sitting directly below a major technical resistance level while geopolitical risks are simultaneously pushing oil prices higher. The chart still favors the bulls: price remains within an ascending structure, RSI is at 62.97, and MACD remains positive. But the reaction around 53,995.85–54,000 could determine the Dow’s next significant move.
With oil at $82.13 and uncertainty surrounding the Strait of Hormuz still affecting sentiment, a breakout above 54,000 would represent a stronger bullish signal, while a rejection could open the door to a short-term correction.


