



US equity futures are falling sharply in early trading. While a disappointing earnings report from Netflix has contributed to the decline, the primary driver is continued selling pressure on semiconductor stocks. After extraordinary gains in recent months, several prominent names, including Marvell, are undergoing corrections of nearly 50% of their recent advances, aligning with key Fibonacci retracement levels. Against this backdrop of market weakness, this analysis examines the recent price action of the VIX Volatility Index.
For traders utilizing products backed by futures, note that the current July VIX futures contract expires on Tuesday, July 21, triggering the monthly rollover into the August contract. This transition will likely create a price gap, as the August contract currently trades at approximately a $1.09 premium to the July contract. Risk management strategies should account for this structural adjustment.
The VIX is currently trading at 18.96, representing the 30-day implied volatility derived from S&P 500 options. The index has rebounded with increasing momentum over the past five consecutive trading sessions.
Technical Analysis
The current upward move began after the VIX established a local low near 16.80 on July 10. This level has solidified as a critical support area, forming a double bottom pattern after holding firmly during a previous test in early June. This zone also aligns with the lower boundary of an open upside gap dating back to early January.
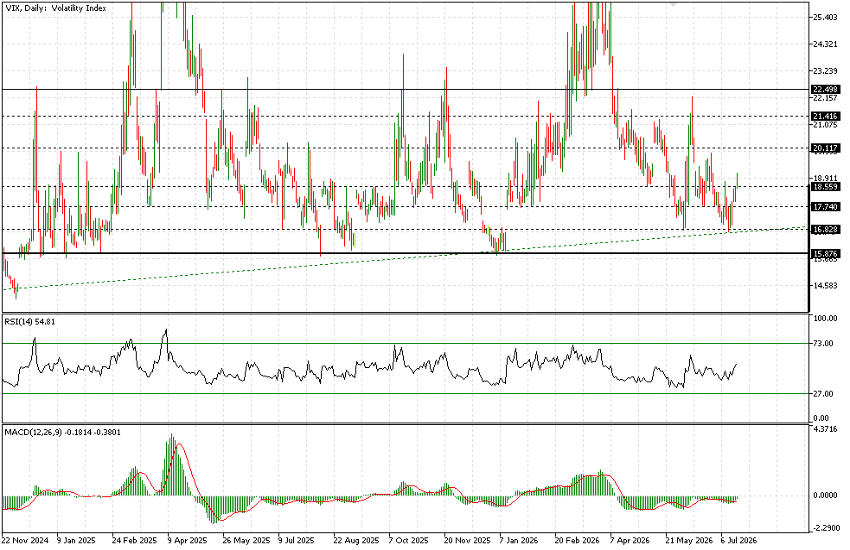
Since the start of 2025, the most significant horizontal support has resided near 15.90. However, buyers entered the market well ahead of this level during the recent decline. A retest of the 15.90 support remains unlikely before the index challenges overhead resistance.
The initial short-term target for the current rally is the 20.00 psychological level. If equity market selling pressure intensifies, a rapid breakout above this level toward 21.40 is highly probable. The VIX historically exhibits asymmetric behavior, rising sharply and explosively during market stress, followed by a gradual, grinding decline. Beyond 21.40, the next major resistance zone is located near 22.50.
Market participants should monitor percentage moves rather than nominal values. A rise from the current level of approximately 19.10 to the initial target of 20.00 represents a 4.7% gain. A continuation toward the 22.50 resistance zone would represent an advance of roughly 17.8%, marking a highly significant expansion in volatility.


