



The Canadian dollar remains under pressure as trade uncertainty and softer oil prices continue to weigh on market sentiment. With roughly 75% of Canada’s exports destined for the United States, USD/CAD is particularly sensitive to changes in bilateral trade policy and commodity markets. As the July 2026 USMCA joint review approaches, investors are closely watching whether the pair can maintain support above the 1.4150 area amid growing concerns over Canada’s economic outlook.
Canada’s economy benefits from strong energy and mining exports, a stable banking system, and close integration with the US economy under the USMCA. However, its heavy reliance on energy exports means the Canadian dollar typically strengthens when oil prices rise and weakens when oil prices decline.
As of early July 2026, USD/CAD is trading around 1.417, with the pair constrained by softer oil prices and ongoing uncertainty surrounding the future of the USMCA. The United States-Mexico-Canada Agreement replaced NAFTA in 2020 following renegotiations during Donald Trump’s first presidential term. The agreement governs tariffs, rules of origin, labour standards, agriculture, digital trade, and dispute resolution among the three countries.
Recent weakness in the Canadian dollar has been driven primarily by trade policy risks and a softer domestic economic outlook. The July 2026 USMCA joint review remains a key source of uncertainty, with any escalation in trade tensions likely to weigh further on the Loonie. At the same time, Canada’s weakening growth outlook and unfavourable Canada-US two-year yield spreads have made the Canadian dollar one of the weakest reserve currencies in recent weeks.
Technical Analysis
The Canadian dollar has weakened by 4.38% since USD/CAD bottomed at 1.3550 on May 1, reaching yesterday’s settlement at 1.4168. Its close relationship with crude oil and the broader commodities sector continues to play a significant role in its performance. Several major currency pairs, including EUR/USD and GBP/USD, have also returned to price levels last seen in April and May 2025, suggesting the Loonie’s weakness is part of a broader market trend rather than an isolated move.
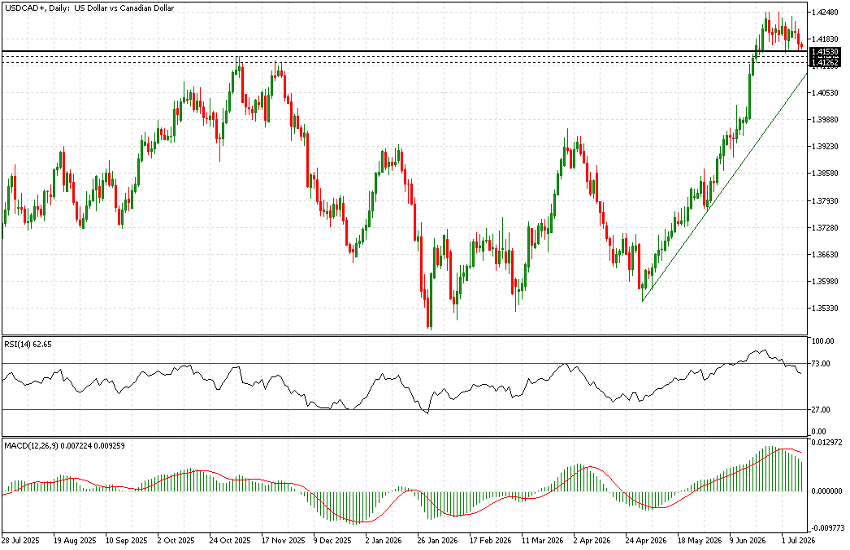
The daily USD/CAD chart highlights an important technical setup. The support levels at 1.4140 and 1.4125 correspond to the previous highs recorded in October and November 2025. Those levels previously acted as strong resistance before the pair reversed toward 1.3550. Over the past two weeks, however, both levels have been broken to the upside and successfully retested several times.
The most recent pullback reached 1.4153, reinforcing the broader 1.4125-1.4155 support zone. This area is now attempting to establish itself as a solid base for further gains. If support fails, the next downside target is the ascending trendline that has been in place since April, currently located near 1.4085.
Momentum indicators suggest bullish momentum is beginning to fade. The Relative Strength Index (RSI) is retreating from overbought territory, while the Moving Average Convergence Divergence (MACD) is also showing signs of weakening momentum. Although this does not yet confirm a bearish reversal, it suggests buyers may need fresh catalysts to sustain the recent rally.
A broader technical perspective also provides useful context. On the 10-year weekly chart, USD/CAD has spent relatively little time trading above its current levels. Although the pair briefly rallied to around 1.48 in early 2025, that move lasted only about one quarter before being fully retraced, with the exchange rate returning to what has historically been a more typical trading range. This suggests the current price area remains significant from a long-term technical perspective, making the 1.4125-1.4155 support zone a critical level to monitor in the sessions ahead.


