

This morning, the Reserve Bank of Australia left its policy rate unchanged at 3.6% for the fourth consecutive meeting, with AUD/USD emerging as the best performer among major currency pairs. The RBA is the first of the four major central banks meeting this week, all of which face the same challenge: balancing inflation that remains stubbornly above target with an economy that is still running at a reasonably solid cruising speed, yet at clear risk of slowing in the coming months.
Australia’s macroeconomic data point to GDP growth of 2.1% and a low unemployment rate of 4.3%, although joblessness has stabilized at levels above those seen earlier in the year (2025 started at 3.9%). Economic activity is being supported by household consumption and private investment; however, rising prices are eroding purchasing power, reflected in subdued per-capita GDP growth. Somewhat surprisingly—at least to the author—exports have shown notable volatility.
Despite Australia’s status as a major exporter of iron ore, coal, and commodities in general (including gold), the trade balance has been trending lower since mid-2022.
The RBA entered an easing cycle in November 2023 and, as noted, paused only recently, in August of this year. It appears investors had anticipated this shift months in advance, as AUD/USD has not retreated since April 2025 and instead staged a solid rebound before stabilizing around current levels.
Technical Analysis
AUD/USD began the year around 0.62 and has since climbed slowly but steadily—setting aside the tariff-related volatility in April—to the current level near 0.6638. In fact, throughout the second half of the year the pair has largely traded sideways within a range between 0.6460 and levels very close to the current 0.6620.
Only in late September did it briefly test 0.6703, a level that now appears to be the next directional target. The pair has recorded 13 consecutive sessions of gains, naturally pushing key indicators (RSI, MACD) into firmly constructive territory.
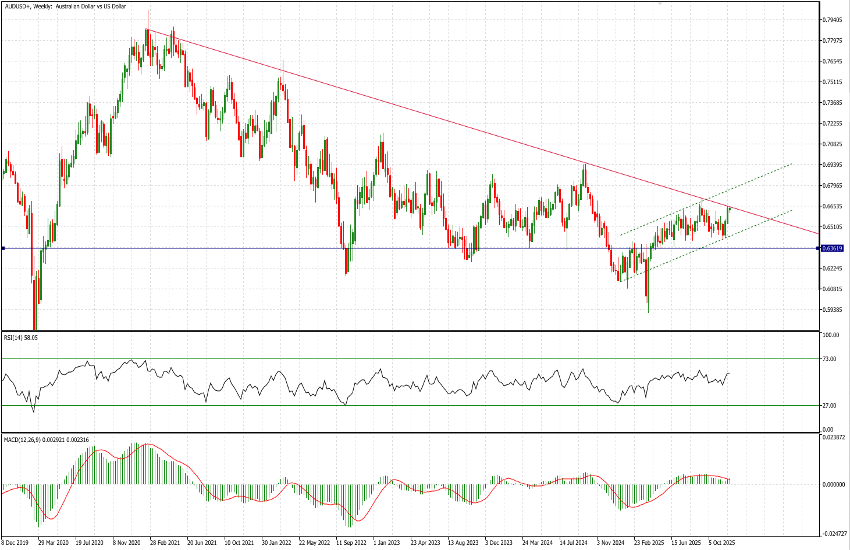
Moreover, the long-term chart is particularly noteworthy: price action is now testing the major descending trendline originating in 2021.
For medium- to long-term investors, a degree of patience may be warranted to observe the market’s reaction to this structural level. A breakout would target 0.6710 initially, followed by 0.6760 and ultimately 0.6795. An overshoot toward 0.6870 could materialize should market sentiment turn exuberant.
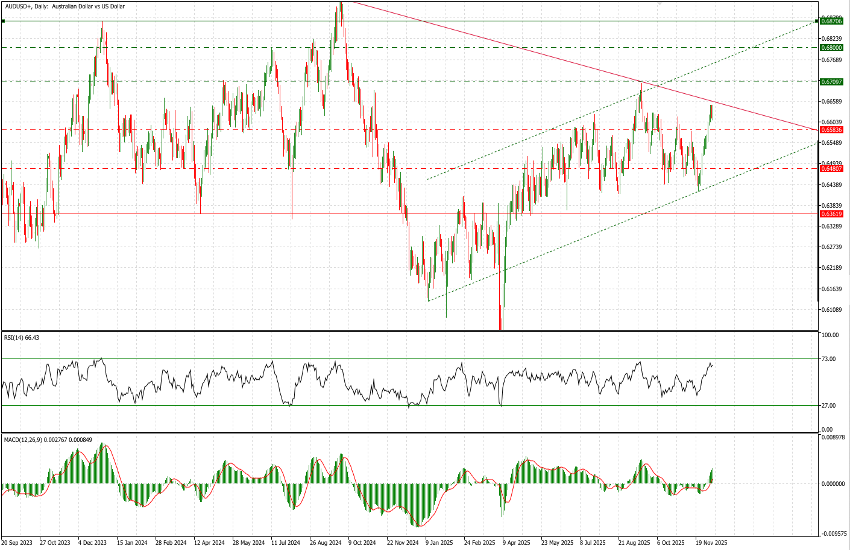
On the downside, support levels to monitor include 0.6585, and—more importantly—0.6480 and 0.63630. That said, these downside scenarios are not our base case.


