


The CPI, also known as the Consumer Price Index, is one of the most critical economic indicators in the market. This article explains what it is, how it is calculated, and how it affects investments.
The Consumer Price Index, often abbreviated as CPI, measures the price variations of a representative basket of goods and services consumed by households. Closely tied to inflation, the CPI provides insights into changes in the cost of living. But how is it calculated, and how does it influence investments?
What is the CPI?
The CPI (Consumer Price Index) is an indicator that analyzes the variation in the price of a representative basket of goods and services consumed by households. It is a key metric for evaluating inflation trends and the cost of living within a country, playing a fundamental role in the national economy.
The CPI typically comprises twelve different categories, weighted according to the proportion of income consumers generally spend on each. These categories and their respective weightings are revised annually to reflect changing consumer habits. For 2024, the categories and their weightings are as follows:
- Teaching: 1.9%
- Communications: 3.3%
- Alcoholic beverages and tobacco: 3.8%
- Clothing and footwear: 3.9%
- Household items: 5.3%
- Medicinal: 5.8%
- Others: 7.8%
- Leisure and culture: 8.6%
- Housing: 12%
- Hotels, cafes, and restaurants: 13.9%
- Transportation: 14.4%
- Food and non-alcoholic beverages: 19.2%
When is the CPI Published?
The Consumer Price Index (CPI) is released monthly, typically between the 10th and 15th of the month. Before the official release, an “advance figure” is often published, providing an estimate of the expected CPI data. This preliminary figure helps market participants anticipate economic trends and prepare for potential market movements.
CPI Types and Characteristics
Core CPI
Often referred to as underlying inflation, excludes the prices of unprocessed food and energy products. These items are known for their frequent price volatility, which can distort the broader inflation picture. By focusing on more stable components, Core CPI provides a clearer and more consistent view of a country’s price evolution, making it a crucial tool for policymakers and analysts.
Harmonized CPI (HICP)
Is used within the European Union to facilitate comparisons of price indices across member states. It employs a standardized basket of goods and services to ensure consistency in measurements across diverse economies within the Eurozone. This harmonization is particularly important for evaluating inflation trends and ensuring effective monetary policy within the EU.
How is the CPI Calculated?
To calculate the CPI, a base year is selected, set at a value of 100, which serves as the benchmark.
- Select the Basket: A representative basket of goods and services is chosen, reflecting typical consumer spending patterns.
- Determine Base-Year Costs: Data is collected on the prices of these items during the base year.
- Determine Current Costs: The cost of the same basket is calculated for the current year.
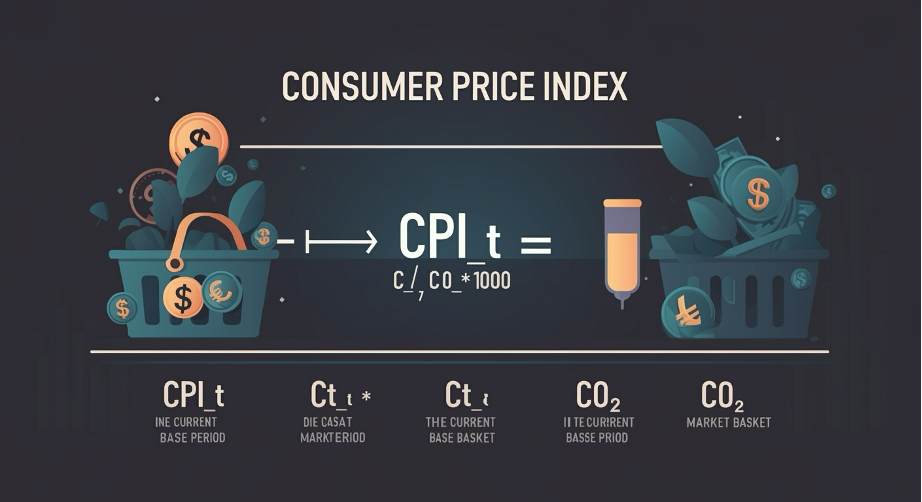
- The CPI is derived using the formula:
CPI=(Current Basket CostBase-Year Basket Cost)×100\text{CPI} = \left( \frac{\text{Current Basket Cost}}{\text{Base-Year Basket Cost}} \right) \times 100CPI=(Base-Year Basket CostCurrent Basket Cost)×100
For example, if the base-year basket costs $100 and the current-year basket costs $120, the CPI would be calculated as follow:
This index is usually updated monthly, quarterly, or annually, depending on the frequency of data collection.
Differences Between Inflation and CPI
While both CPI and inflation measure price changes, they serve distinct purposes. The CPI specifically tracks the cost of a basket of final goods and services consumed directly by households, such as food, clothing, and transportation. It excludes intermediate goods used in production, which are essential for businesses but not directly purchased by consumers.
Inflation, on the other hand, is a broader concept encompassing overall price level changes across the economy, including those of intermediate goods. This distinction is crucial for interpreting economic news, as the CPI provides a consumer-focused view, whereas inflation reflects a more comprehensive economic perspective, influencing both consumer and industrial sectors.
What are the Effects of the CPI?
The CPI directly impacts the economy and individual purchasing power. A rising CPI indicates that goods and services are becoming more expensive, reducing purchasing power unless wages increase correspondingly.
Companies often adjust employee salaries annually in line with the CPI to preserve purchasing power.
For investments, the CPI influences real returns. If investment returns are lower than the CPI, purchasing power diminishes. For instance, if investments yield a 5% return but the CPI is 2%, the real return is approximately 2.94%. Thus, the CPI is a crucial factor when selecting investment instruments.
Conclusion
The Consumer Price Index is a vital tool for measuring inflation and shaping government policies, business decisions, and personal financial planning. By monitoring changes in the prices of everyday goods and services, the CPI provides valuable insights into the economy’s state and direction. Investors can leverage this information to make informed decisions, while individuals can use it to manage their finances more effectively.