



Semiconductor stocks came under heavy selling pressure last week as investors reassessed the outlook for artificial intelligence-related spending. The Philadelphia Semiconductor Sector Index (SOXX) fell 10.25% over the past five trading sessions and now trades 20.21% below its record closing high reached on June 22, officially entering bear market territory.
The sector’s remarkable rally over recent months was fuelled by aggressive capital expenditure from hyperscale technology companies investing heavily in AI infrastructure. However, growing concerns that these companies may begin slowing investment in chips and data centres have weakened investor sentiment. Those concerns intensified following the release of a powerful open-source AI model, raising questions about whether frontier AI development will require the same level of computing power previously anticipated.
Among the stocks hit hardest was Micron (MU), the largest holding in the SOXX ETF with an 8.5% weighting, ahead of AMD at 8.1% and Nvidia at 6.8%. After an extraordinary rally earlier this year, the stock has extended its correction as technical momentum continues to deteriorate.
Technical Analysis
Micron (MU) surged an impressive 294% between March 30 and June 25. Since reaching that peak, however, the stock has declined 32.34%. Although it is not immediately visible on the chart, Friday’s intraday low of $804 came close to the 50% Fibonacci retracement of the entire rally, located near $780.
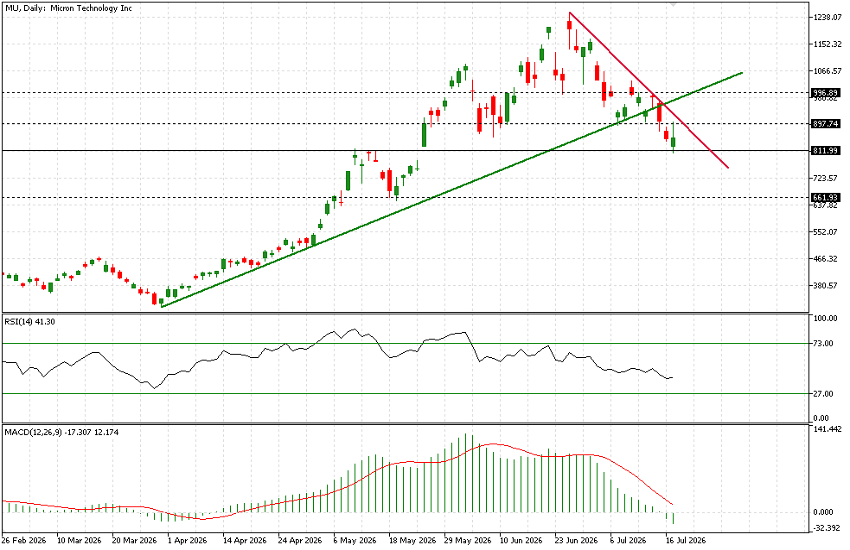
More notably, the stock has broken decisively below a steep ascending trendline. Momentum indicators have also weakened, with the Relative Strength Index (RSI) falling to 41.30 and the Moving Average Convergence Divergence (MACD) moving below the zero line. Friday’s candlestick also deserves attention. Despite an intraday rebound attempt across the semiconductor sector, MU formed a candle with a long upper shadow, which is generally viewed as a bearish technical signal.
On the downside, $811 remains an important support level, as the stock consolidated there in May before resuming its rally. The next significant support is located around $660. While that represents a considerable decline from current levels, such price swings are not unusual given the stock’s elevated volatility.
On the upside, the first resistance level is the psychological $900 area, which was briefly tested on Friday. Above that, $1,000 represents the next major resistance and aligns closely with the broken ascending trendline, making it a likely level for a technical retest.
Trading volume during the previous rally was exceptionally strong, suggesting that a substantial number of positions remain open, with many investors potentially holding unrealized losses. At the same time, the recent correction may reinforce the view that paying increasingly higher valuations after such an extended rally was unsustainable. Although momentum indicators have deteriorated considerably, they remain well above oversold levels.
Elevated volatility is also likely to limit the pace of any recovery. Daily price movements exceeding 5% may remain common, while intraday swings approaching double-digit percentages could continue to discourage stable buying interest.
The AI-driven investment cycle has delivered extraordinary gains for semiconductor manufacturers. However, the recent correction serves as another reminder that even high-quality companies can become poor investments when purchased at excessive valuations.