



EUR/USD traded with a bearish bias during the European session on Tuesday, July 28, as market participants remained cautious ahead of the Federal Reserve’s policy decision later this week. The US Dollar continued to find support from expectations surrounding US monetary policy, while traders refrained from taking aggressive positions before the central bank’s announcement.
Technically, EUR/USD is trading around 1.1365, extending its decline after repeatedly failing to break above the 1.1450 resistance zone. The pair has formed a series of lower highs over recent sessions, reinforcing the prevailing bearish trend and pushing price back towards the lower boundary of its recent value area.
Momentum indicators continue to favour sellers. The Relative Strength Index (RSI) is hovering around 38, suggesting bearish momentum remains intact while staying above oversold territory. Meanwhile, the Moving Average Convergence Divergence (MACD) remains below the zero line, confirming that downside momentum continues to dominate despite signs that selling pressure has moderated.
Technical Analysis
The immediate support is located at 1.1325, which marks the lower boundary of the recent trading range. A decisive break below this level could confirm a bearish breakout and expose the pair to further downside. On the upside, initial resistance is seen around 1.1400, followed by the stronger 1.1450 resistance area, where previous recovery attempts have repeatedly been rejected. A sustained move above these levels would be needed to weaken the current bearish outlook and improve short-term sentiment.
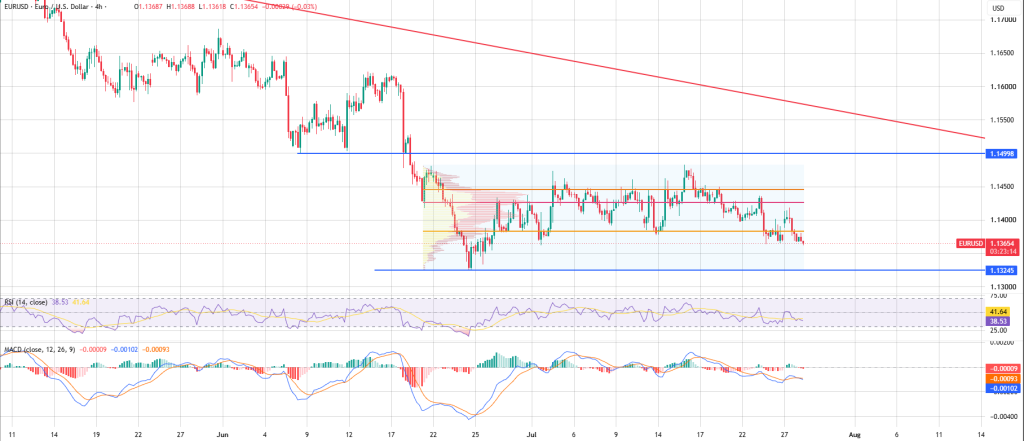
Another key technical signal comes from the current price position within the recent value area. EUR/USD is trading near the lower edge of the volume profile, indicating that sellers continue to dominate while buyers have yet to establish meaningful support. If the pair remains below this zone, bearish momentum could strengthen as selling interest increases. However, a successful defence of the support area may encourage short-term consolidation or a corrective rebound before the next directional move.
For traders, the 1.1325 support zone will be the key level to watch throughout the European and upcoming US trading sessions. A confirmed breakdown could signal a continuation of the broader downtrend, while a rebound from support may encourage another test of the 1.1400–1.1450 resistance zone. With the Federal Reserve’s policy decision approaching, these technical levels are likely to become important reference points for identifying potential breakout opportunities as market volatility increases.