

Nasdaq futures are trading sharply lower this morning after technology stocks came under pressure in the previous session. While several of the index’s heavyweight names ended yesterday firmly in the red, the Nasdaq itself limited losses to just 0.19%, effectively closing the day little changed.
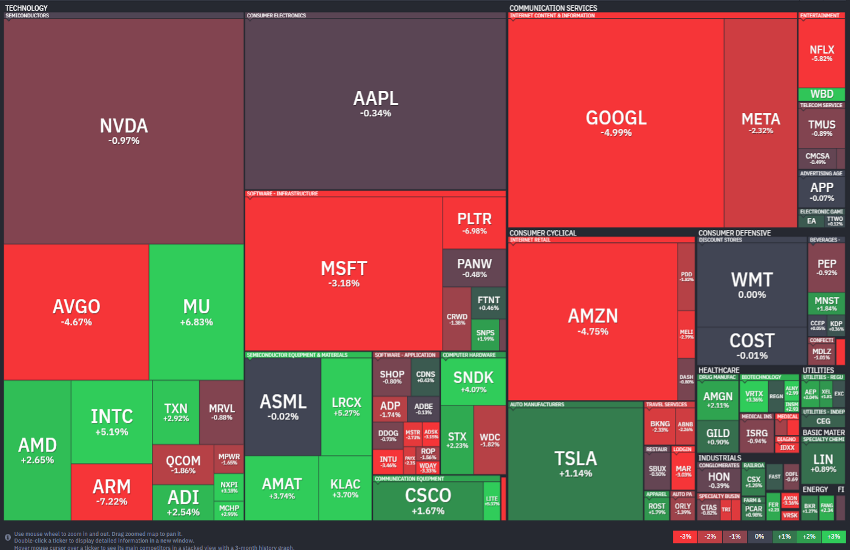
Amazon declined 4.75%, Meta lost 2.32%, and Alphabet fell 5% amid concerns surrounding the departure of two high-profile AI researchers to rival companies. Selling pressure also extended to the semiconductor sector, with Broadcom dropping 4.67% and Nvidia slipping 0.97%.
Gains were concentrated in a handful of semiconductor names. Micron advanced 6.83% ahead of its earnings report after tomorrow’s closing bell, while Intel rose 5.19% and AMD gained 2.65%. Together, these three stocks now account for nearly 7.5% of the index’s weighting. Meanwhile, Micron’s market capitalisation has climbed above the $1 trillion mark to $1.37 trillion, while AMD is not far behind at $899.5 billion.
This morning, however, futures are firmly in the red, down 1.87% to $29,787 at the time of writing. Overnight, South Korea’s KOSPI index, home to major chipmakers Samsung and SK Hynix, fell more than 4%.
Against this backdrop, the technical setup for the Nasdaq warrants close attention on both the daily and intraday timeframes.
Technical Analysis
The rebound that began on June 9, following the 8.34% correction from the highs around $30,750, failed to establish fresh record highs. Instead, price action stalled for five consecutive sessions around the $30,500 area and was unable to break above $30,650.
At the same time, the RSI has continued to deteriorate, showing a clear bearish divergence that has been developing since early May. In addition, the steep uptrend line in place since March 30 was broken on June 4. Together, these signals point to a weakening technical backdrop.
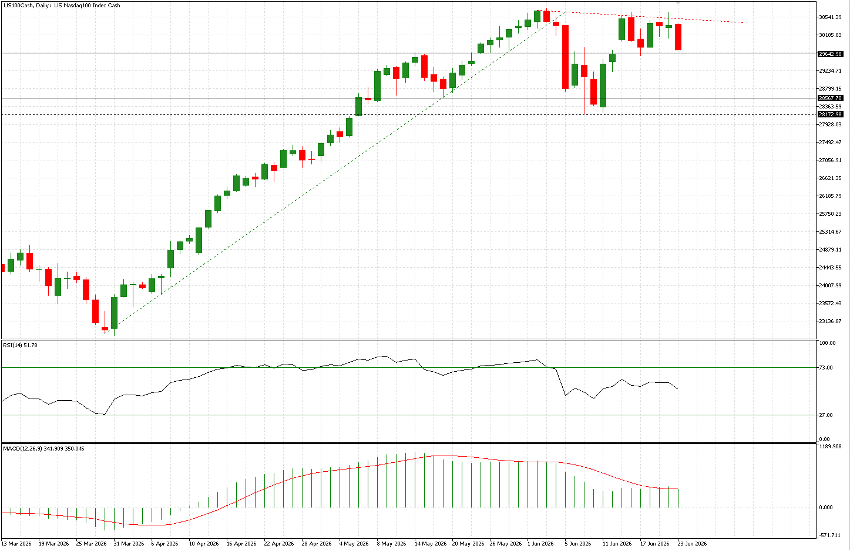
On the daily chart, the $29,650 area represents the first major support level. Below that, $28,600 and $28,175 are the next downside levels to monitor.
The 30-minute chart provides a clearer intraday picture. The same $29,650 level remains the key downside pivot for today’s session, while $30,000 stands as the critical resistance level on the upside.
This area acted as a firm floor from June 15 onward and was only briefly breached on June 17, when the index quickly dipped toward support before buyers stepped in aggressively.
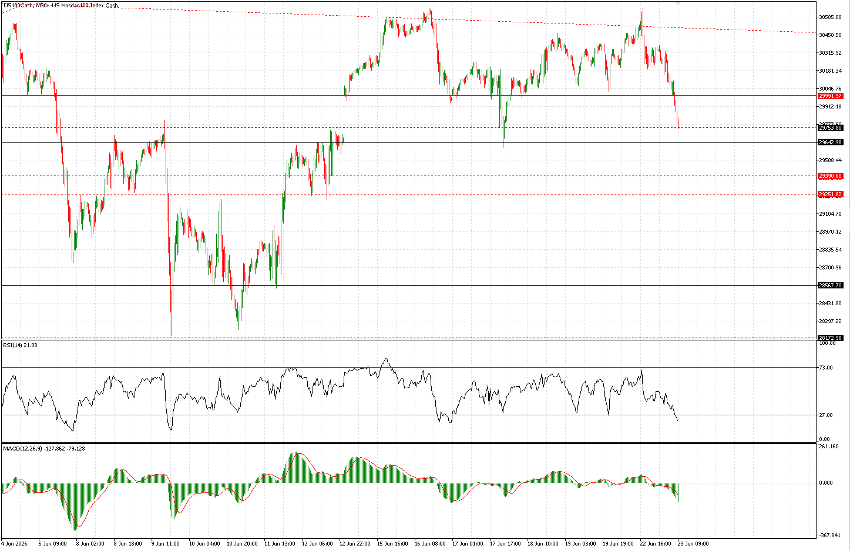
Around $29,750, roughly where the index is trading at the time of writing, lies a secondary support zone that could attract some bargain buying. However, the technical structure suggests a retest of $29,650 before any potential attempt to reclaim the $30,000 level from below.
Should that support fail to hold, downside attention would shift to $29,390, followed by $29,250.

