Despite its reputation as a safe haven, gold has not performed particularly well following the outbreak of tensions in the Middle East. At yesterday’s close in New York, the yellow metal settled at $5,134.39, $144 lower than Friday, February 27, or – if preferred – a decline of 2.72%.
Why this move when the safe-haven narrative is being widely discussed? First, the time factor: eight sessions are ultimately too few to judge the reaction of an asset that had already rallied strongly beforehand and that, in the first month of the year alone, had at one point gained as much as 29%. Looking at the parabolic chart that has formed from 2023 to today already gives a first indication of why large gains have already been made and why there may be limits to the explosiveness of further moves.
From a more technical perspective, it is also important to consider the surge in the long end of the U.S. yield curve, particularly the 10-year Treasury yield, which has consistently shown one of the strongest inverse correlations with gold in its real-rate component: when rates rise, gold tends to fall. Long-term rates themselves often show a strong relationship with oil prices, as oil is a key component influencing medium- to long-term inflation expectations. The recent spike has led investors to sell U.S. Treasuries, or demand lower prices for them, in search of higher yields.
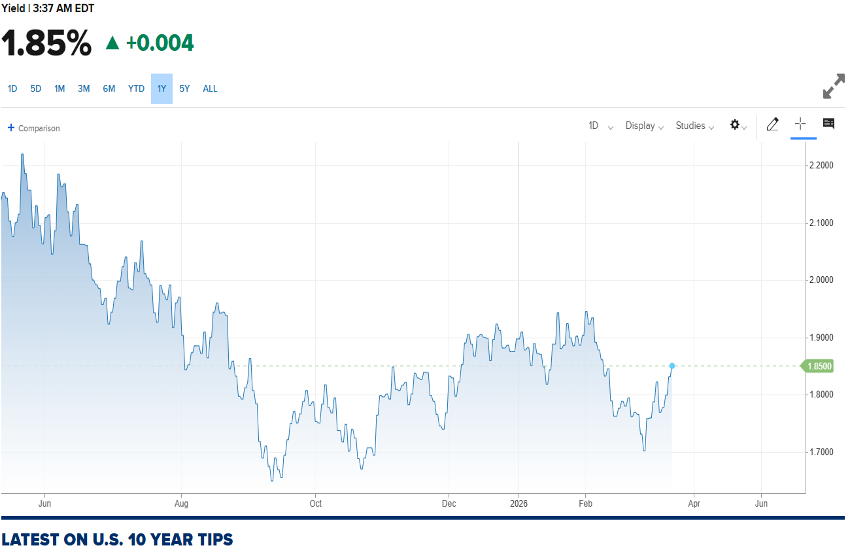
The 10-year U.S. Treasury yield has moved from 3.962% at the close on February 27 to 4.2320% this morning, representing a significant increase. Even more relevant is the move in the 10-year U.S. TIPS yield—which can be considered a good approximation of the real interest rate, as these bonds provide inflation protection. It has risen from 1.70% to 1.85%. Meanwhile, gold has largely remained range-bound.
TECHNICAL ANALYSIS
Today we focus on a one-hour chart covering the last month and a half, shorter than our usual timeframe. The key near-term levels are two: $5,090 on the downside and $5,240 on the upside. Since February 23, gold has been trading between these levels without major shocks and is currently retreating from a test of the upper boundary.
If the move continues lower, two additional levels to monitor are $5,005 and $4,885. The latter would lie very close to—or possibly slightly below—the very steep trendline that originated in early August 2025.
On the upside, a break above $5,240 would open room toward $5,312 and then $5,408. That said, gold has recently formed a lower low on the daily chart, precisely on March 2, the beginning of the conflict. On the daily timeframe, a wedge pattern appears to be forming, and some bullish observers might even interpret the structure as a potential cup-and-handle formation.
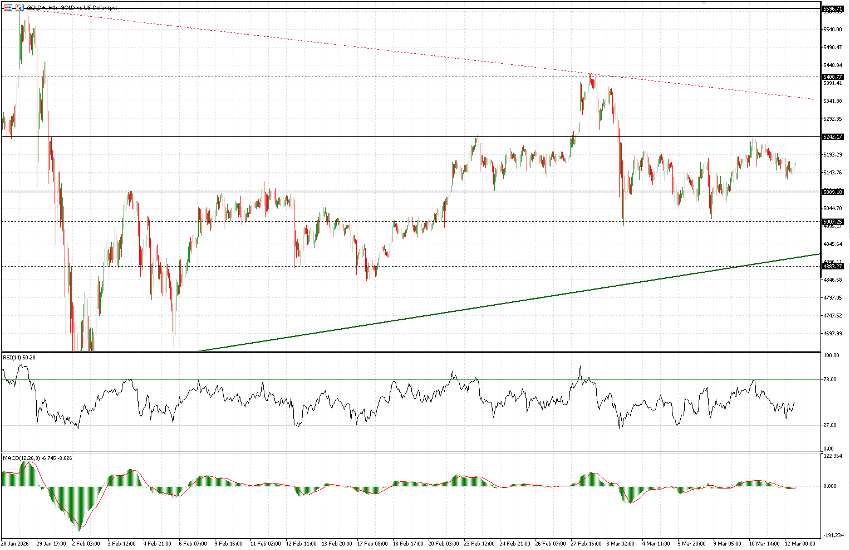
Daily indicators remain broadly neutral. The MACD histogram has crossed to the downside, while moving averages remain below price and continue to provide support. The 50-day moving average now stands at $4,935—very close to the level mentioned above—while the 21-day moving average runs almost exactly through today’s low at $5,182.