NVDA is no longer the primary driver of earnings among stocks linked to the microchip sector. From the lows of March 30 to yesterday’s close, the stock has risen by 20.83%. However, other well-known names have significantly outperformed. Qualcomm has gained 38.03% from recent lows, Broadcom 43.64%, AMD is up 77.09%, and Micron, the standout performer in recent months, has climbed 458% since last August, including an 85.06% increase in just the past month.
These gains have largely occurred within a single month, spanning just over 20 trading sessions.
NVDA continues to lead in strategic deals, investments, and acquisitions. In February, it acquired the Israeli company Illumex, and over the past two months, it has signed partnerships with Meta, Marvell, and Hewlett Packard, among others. However, market sentiment appears to be shifting, with investor enthusiasm showing signs of moderation.
It remains uncertain whether this shift will be sufficient to drive broader indices higher. NVDA currently holds a weight of 12.92% on the Nasdaq, while the four aforementioned stocks together account for 8.99% of the index, with Broadcom representing the largest share at 5.28%.
This analysis focuses on the recent false breakout observed in NVDA.
Technical Analysis
The false breakout is clearly visible on the 4-hour chart. On April 27, NVDA briefly moved above the previous high of $211.99, recorded on October 29. The stock traded above this level for just over two sessions, reaching a high of $216.68.
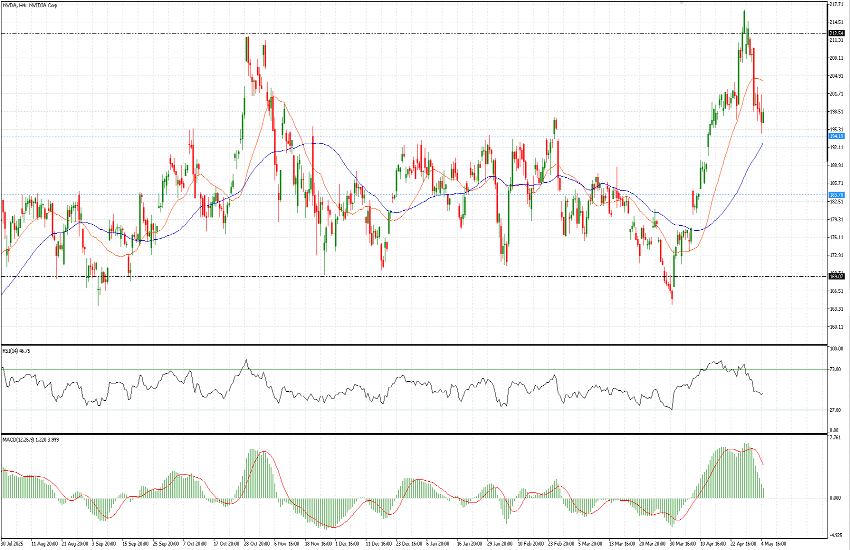
NVDA, 4h, Jul 2025 – Present
This is not the first occurrence of a false breakout. A similar pattern appeared approximately one month ago near the lows, when the $169 level appeared to have been breached. Instead, that level marked the beginning of a rally that pushed the stock back toward the upper range it has occupied since last summer.
NVDA has remained range-bound for several months, fluctuating between approximately $170 and $210, with most trading activity occurring below $195. This level is one of four key static levels to monitor closely, alongside $184.
Momentum indicators are beginning to weaken. Both RSI and MACD are turning negative as the stock declines. As of yesterday, NVDA showed a modest bounce just below the $195 level.
From a medium-term perspective, a move back toward the lower end of the established range appears plausible. Earnings are due in the coming weeks, typically marking the close of the reporting season. The key question remains how the market will respond to signs of weakness in one of its leading stocks, particularly amid ongoing geopolitical uncertainty.