



A rotation out of technology stocks has reshaped market performance across U.S. equities. While the Dow Jones, S&P 500, and Nasdaq recorded solid gains, the Russell 2000 remained largely flat, underperforming despite strength in healthcare and financials. The divergence highlights investors’ continued preference for large-cap stocks over small caps.
The Russell 2000 consists primarily of small-cap companies, with most constituents having market capitalisations between $300 million and $5 billion, although the index also includes micro-cap firms and a small number of significantly larger outliers.
Compared with large cap benchmarks, the Russell 2000 is more evenly diversified across sectors and has a much smaller allocation to Big Tech. Healthcare represents approximately 18% to 20% of the index and remains heavily weighted towards biotechnology companies, while industrials account for around 17% to 19%. Financials make up roughly 10% to 16%, with a significant concentration in regional banks and insurers.
Technology accounts for only the high teens, compared with approximately 34% in the S&P 500. The remainder of the index is spread across consumer discretionary, energy, materials, real estate, and utilities. Over the past year, financials and industrials have alternated as the largest sectors depending on index reconstitutions and interest rate expectations, although healthcare has recently become the largest allocation.
As a market capitalization weighted index of around 2,000 companies, the Russell 2000 is not dominated by individual stocks in the way the S&P 500 is by companies such as Nvidia and Apple. The largest constituent typically accounts for well below 1% of the index, while the top ten holdings together represent only around 3% to 6% of total index weight.
However, the index methodology can occasionally produce unusually large constituents. Companies are re-ranked only once a year, with a move to a semi-annual schedule beginning in 2026. As a result, stocks that experience substantial gains after inclusion can remain in the Russell 2000 despite growing far beyond the typical size range. Recent examples include Carvana and MicroStrategy.
Despite the recent rotation away from technology, which declined 2.16%, and into healthcare (+5.21%) and financials (+4.06%), the Russell 2000 failed to benefit meaningfully. This largely reflects the continued outperformance of large cap equities, the only market capitalisation segment to post gains across both value and growth styles, together with strong demand for low volatility stocks (+1.71%).
Technical Analysis
The Russell 2000 continues to display constructive technical price action. Since April 2025, the index has traded within a well defined ascending channel, with several intermediate support and resistance levels developing inside that structure.
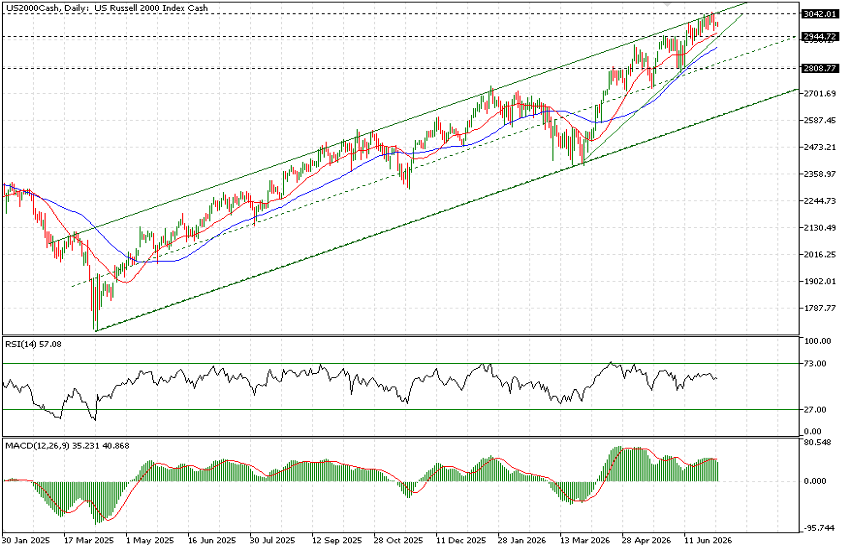
Technical indicators remain broadly positive, although both the RSI and MACD are showing bearish divergence, suggesting that the strong momentum behind the rally may become more difficult to sustain over the longer term. The 21 day moving average (2,951) and the 50 day moving average (2,888) continue to provide support beneath the current price of 2,995.
Key medium term support levels are located at 2,945 and 2,808, while the primary resistance remains the all time high near 3,048. From a technical perspective, it is also encouraging that the steeper trendline originating in March remains intact and currently sits near the 2,950 area, comfortably below current market prices.
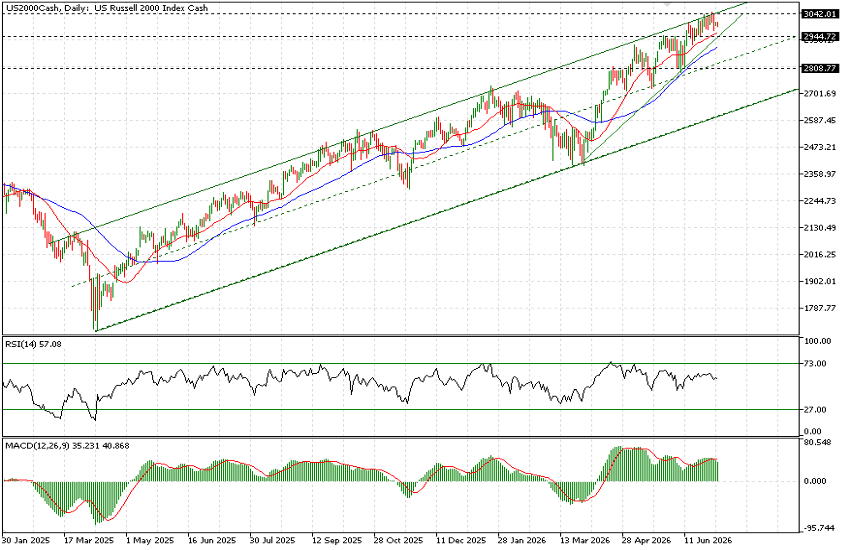
On the one hour chart, the Russell 2000 has remained in a period of consolidation since the beginning of summer. During this period, the index has traded within a range of approximately 2,945 to 3,040, representing a movement of around 3%.
Several key intraday levels have emerged within this range, including 3,025, 3,005, 2,990, 2,970, and 2,956. Price action has repeatedly gravitated towards these levels, reinforcing their technical significance.
Our near term bias remains that these lower support levels are likely to be tested again before another attempt to retest the underlying bullish trendline. While the broader trend remains constructive, momentum indicators suggest traders should monitor price action closely for signs of weakening buying pressure.


