



It has not been a good month so far for the US500 (S&P 500), and we are only on February 17. The index’s month-to-date performance currently stands at -1.48%, which has also pushed the year-to-date return into negative territory (-0.33% as of last Friday’s close at 6,836). This morning, following yesterday’s market holiday, the index is down an additional 0.18%.
Statistically, February is one of the weakest months for equity markets, surpassed in negative performance mainly by August and September. Historically, late winter months — including March — used to be even more challenging, which likely contributed to the term “bears” for sellers, as it coincides with the period when bears emerge from hibernation.
That said, since December 2025 the US500 has been trading within a range bounded by 6,730 on the downside and 7,000 on the upside. Within this range, however, there is an additional and particularly significant level at 6,830.
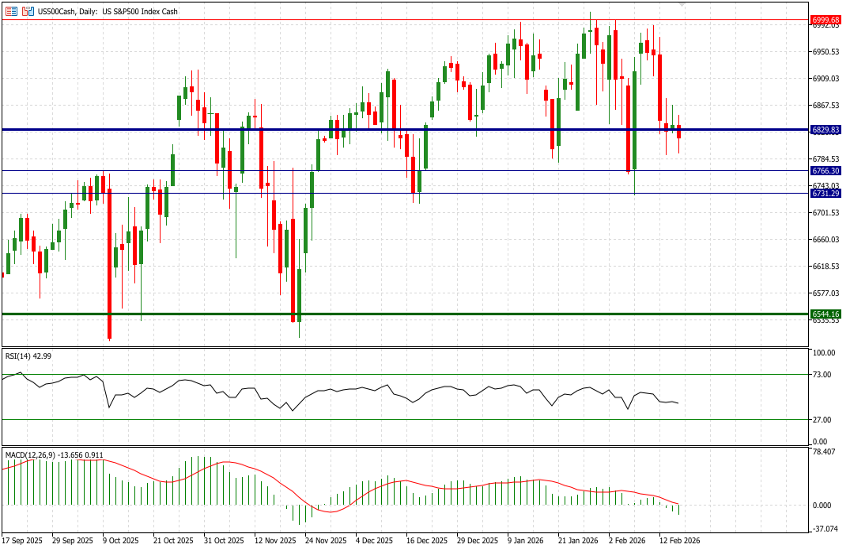
At first glance, this may seem unusual, as the price has recorded a daily low at that level on only two occasions (January 2 and February 12). However, a closer examination reveals a clear pattern: each time the index broke below and closed under 6,830, it staged an immediate and strong rebound back above it. This occurred on January 20, February 5, and again last Friday.
For this reason, we consider 6,830 to be a key pivot level. At present, the index is once again trading below it (around 6,815 at the time of writing).
The outcome could mirror previous instances — a rebound followed by a renewed move toward 7,000. However, this time may prove different, particularly given the two tests in such close succession. The RSI is trending lower and has fallen below 50, while the MACD has also turned negative. Moreover, following two exceptional years, it is difficult to argue that the market remains particularly inexpensive — to the extent that valuation alone can be relied upon.
If this view proves correct, we would expect further downside this week, with a test of two key support levels at 6,765 and 6,730. Below these, additional support levels are present, but the broader trajectory would point toward last autumn’s lows in the 6,550 area.
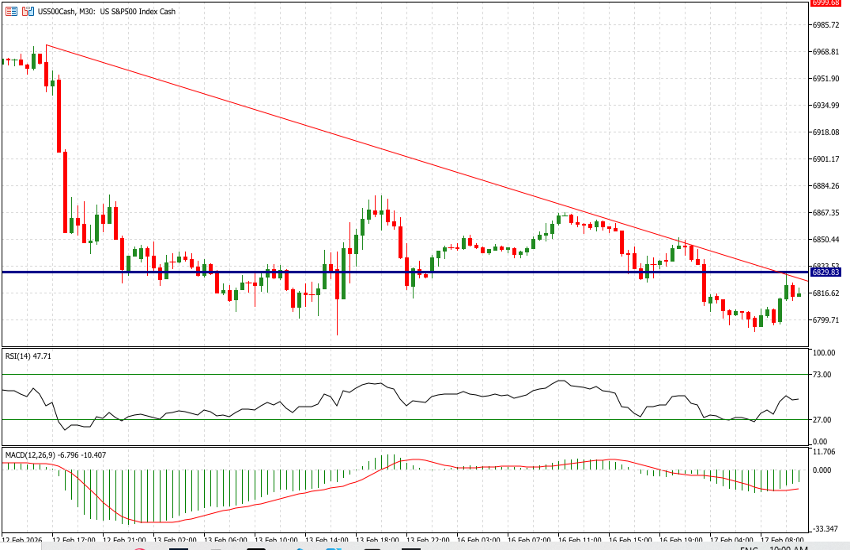
On a shorter timeframe — the 30-minute chart — entry and exit levels can be guided by the (relatively weak) trendline originating on February 12, which once again rejected price at 6,830 earlier this morning. Thereafter, attention should turn to this morning’s lows and those recorded on Friday, February 13 — in other words, the 6,790 area.


