



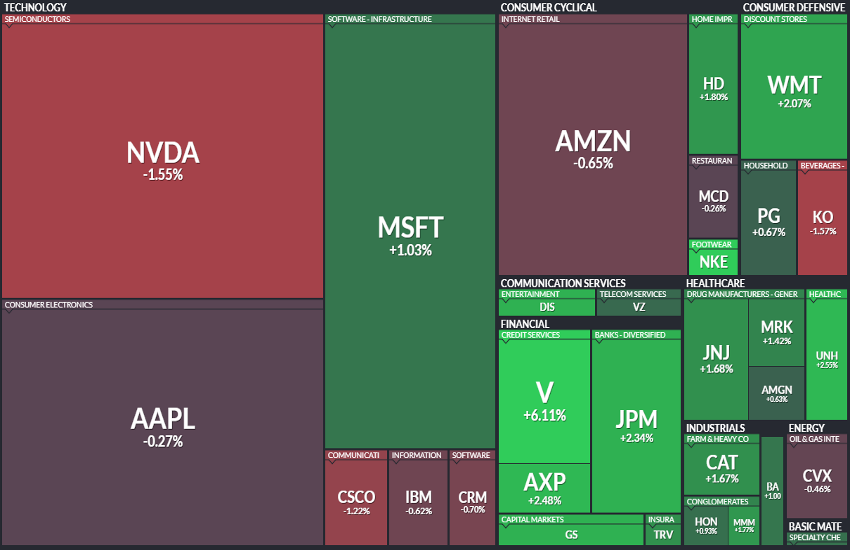
At this point, it is hardly a surprise: after an extended period in which the technology sector led the broader market higher, leadership has rotated notably in recent weeks. In fact, several major names — including NVDA (-1.55%), AMZN (-0.65%), and AAPL (-0.27%) — have weighed on the Nasdaq’s performance. This comes on top of last night’s decline in risk assets following Oracle’s disappointing quarterly revenue numbers and a muddled forward outlook.
Over the past month, the best-performing U.S. sectors have been, in order: Materials (+3.10%), Financials (+1.82%), Industrials (+2.26%), and Health Care (+1.92%). The blue-chip-heavy US30 has outperformed, closing yesterday well above its previous record highs (+1.34% to 48,704), while only the Nasdaq lagged. Even the US500 and US2000 managed to edge higher and register new highs with greater conviction.
Yesterday’s advance in the Dow Jones was driven in part by Bank of America’s upgrade of VISA, which pushed the stock up +6.11%. Goldman Sachs (+2.45%) and Caterpillar (+1.67%) — the two largest constituents of the index by weighting — also delivered strong contributions.
TECHNICAL ANALYSIS
At present, the US30 chart appears technically sound: RSI and MACD remain firmly positive without signaling overbought conditions or clear divergences; the 50- and 100-day moving averages are both upward-sloping yet not excessively stretched from spot levels (3.5% and 5.15% respectively); and price action is contained within a gently rising two-month channel. Overall, this reflects an orderly, sustained, and gradual uptrend over recent months.
There are, however, a few elements worth monitoring, mostly tied to the index’s own strong performance. First, price is now trading close to the upper boundary of the aforementioned channel (currently near 49,100). Second, the red line at the top of the chart represents the upper band of the long-term trend originating in 2020. Price is currently trading above that threshold, which generally makes the level less compelling for long-term investors.
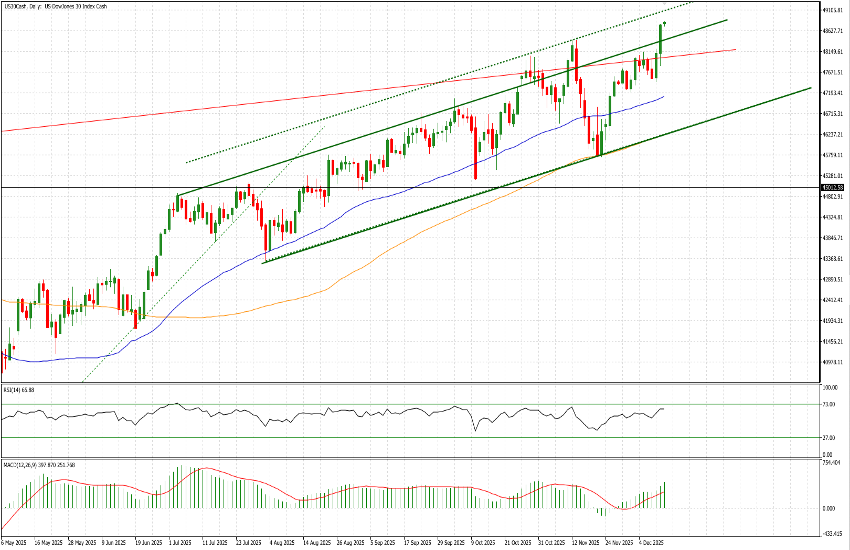
In any case, the technical setup remains robust, and with the index in uncharted territory, there is no immediate indication of a trend reversal. That said, we would be more comfortable initiating new long positions closer to the lower end of the channel rather than near the upper bound. It continues to offer an attractive relative trade, particularly against weaker benchmarks such as the Nasdaq at this stage.


