



With each passing day, the focus for the coming months appears to be increasingly shifting toward companies within the industrial and defense complex—names that investors will likely need to become familiar with in the near future. As recently as Wednesday, January 7, Trump proposed a 2027 federal budget of USD 1.5 trillion, implying an increase of more than 50% compared to the already exceptionally large 2026 budget of USD 901 billion. Beyond its geopolitical implications, this fiscal expansion is clearly intended to provide support to the U.S. domestic market, where—despite some positive developments—enthusiasm around the AI-driven growth engine continues to show signs of fatigue, alongside the early stages of increased selectivity and differentiation among investable names.
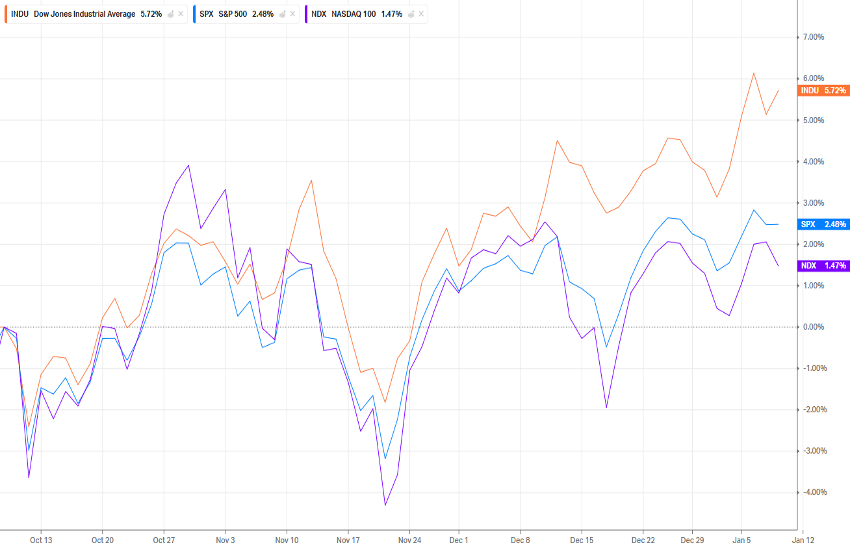
The start of the year has nonetheless been marked by strong performances in several “secondary” stocks, such as Sandisk (SNDK, +23%) following its spin-off from Western Digital, Baidu (BIDU, +20.4%), the Chinese technology player, and—among more systemically relevant names—Micron (MU, +10.7%), a key producer of VRAM used to move data within NVIDIA chips. Conversely, a number of large-cap names have underperformed: most notably Apple (AAPL, -4.72%), which is perceived to be lagging in the development of an updated version of Siri, for which no clear release timeline has yet been communicated. AMD is down 3%, Palantir has declined 11.1%, and even NVIDIA itself is broadly flat at -0.78%.
As a result, the Nasdaq (US100) is underperforming both the S&P 500 (US500) and the Dow Jones (US30), struggling to establish a clear directional trend and continuing to trade sideways at elevated levels, within a range between 25,000 and 26,000.
TECHNICAL ANALYSIS
From a technical perspective, the chart in this case is less orderly than the one analyzed yesterday (EUR/JPY). While a trend can be identified, it is equally true that multiple false breakouts have occurred, ultimately reducing the clarity of the overall structure. This provides a useful opportunity to highlight that, in technical analysis, certain instruments tend to “respect” specific patterns more consistently (for example, fixed income and FX futures), while others do so to a lesser extent—most notably smaller-cap equities, but also secondary commodity markets such as agricultural products.
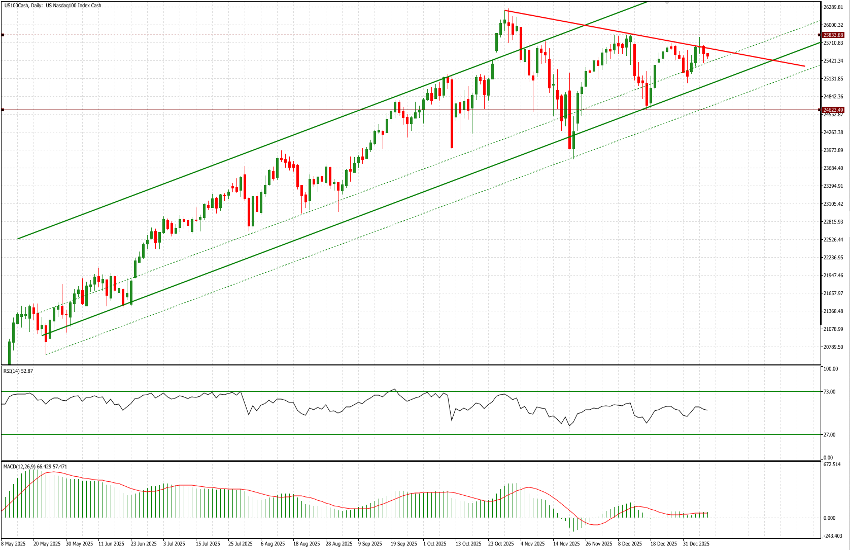
Turning back to the US100, what has been taking shape over recent months—since October—is a triangular consolidation pattern (somebody would call it a flag), the resolution of which will determine whether the next directional move is bullish or bearish. The pattern is approaching maturity, as the distance between the upper and lower boundaries continues to narrow and is expected to fully converge by the fourth week of January (January 23, according to our chart). At present, the relevant range is defined by 25,600 on the upside and 25,050 on the downside. With the index currently trading at 25,515, price action is notably closer to the upper boundary of the triangle, implying a less attractive (i.e., tighter) risk–reward profile for long positions and a relatively more favorable setup on the short side.
Additional key technical levels to monitor are 25,835 on the upside (+1.25%) and 24,625 on the downside (-3.48%).
That said, as with many other instruments in the current environment, we continue to recommend caution and patience. The U.S. technology market is coming off a very strong year, is trading at elevated levels, and may require a period of consolidation. Whether this pause ultimately resolves into a continuation of the upward trend or a corrective phase before a renewed advance will likely become clearer over the coming weeks.


