



Emerging market currencies have experienced a particularly strong two-month period, appreciating significantly against the U.S. dollar. Since 5 November—marking the recent relative peak of the greenback against several major currencies—the euro has strengthened by 3.84% versus the USD. However, higher-beta currencies such as the South African rand (ZAR) and the Mexican peso (MXN) have outperformed materially, gaining 8.83% and 8.09% respectively as of yesterday’s settlement.
Turning to Mexico, the economy appears to be in a soft-landing phase. Growth has slowed to approximately 1% in 2025, constrained by elevated real interest rates, subdued investment, and ongoing weakness in the energy sector. Exports are providing only limited support to overall momentum. On the other hand Inflation has largely normalized. Headline CPI stood at 3.69% at year-end 2025, broadly in line with the central bank’s target. Core inflation, however, remains slightly above 4%, keeping services-related price pressures under close scrutiny. In response to easing inflation dynamics, Banco de México has reduced its policy rate from 11.25% to approximately 7.00%. The central bank is now signaling a pause, seeking to balance support for economic activity with the need to preserve anchored inflation expectations.
The Mexican peso has demonstrated notable resilience in early 2026, recently approaching the 17.00 per USD level (last traded at 17.19). Its appreciation is being driven by three principal factors. First, the carry trade remains attractive, with the policy rate at 7.00% offering a substantial yield differential that continues to attract global investors. Second, fiscal fundamentals remain comparatively solid: despite lingering trade tensions, the fiscal deficit is projected to stabilize in the 3%–4% of GDP range, reinforcing macroeconomic credibility relative to several peer emerging markets. Third, improving external dynamics are supporting the currency. As the confrontational trade rhetoric of 2025 has evolved into more pragmatic USMCA negotiations, manufacturing activity—particularly in the automotive sector—has begun to stabilize, sustaining demand for the peso.
TECHNICAL ANALYSIS
Since April 2025, USDMXN has been in a clear and sustained downtrend, declining from levels close to 21.00 to the current area around 17.17.
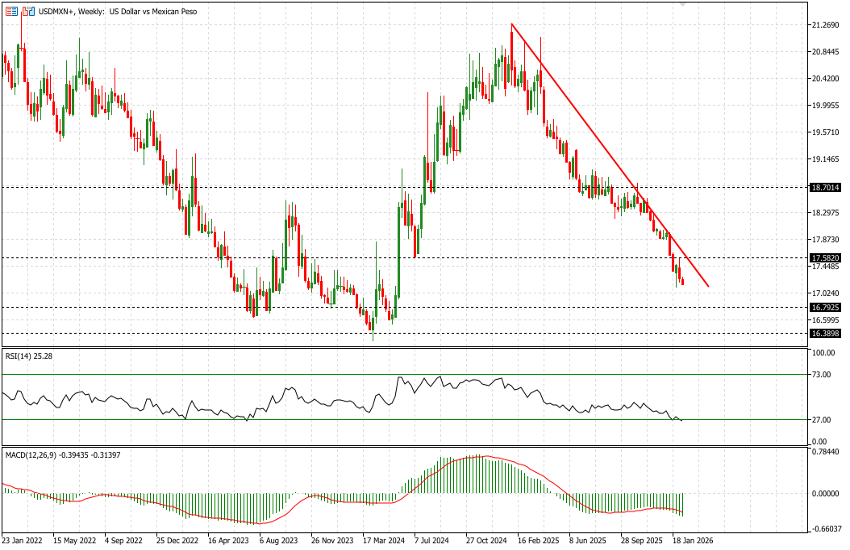
The horizontal levels shown in the first chart represent long-term structural support and resistance zones, validated by price action dating back to 2016–2017 (not displayed for clarity). The pair is now trading below the key 17.58 level. Should downside pressure persist, the next major support areas are located at 16.80 and 16.38.
On the weekly timeframe, momentum indicators are beginning to approach oversold territory. The RSI is gradually unwinding, although a meaningful bullish reversal could require several weeks to materialize.
Shifting to the 4-hour timeframe, price action suggests an attempt to stabilize around 17.12. The rebound toward 17.54 has allowed the formation of a short-term bearish structure, which can be used as a reference framework for risk management and potential entry/exit positioning. On this timeframe, the MACD histogram is close to a bullish crossover of the signal line—despite remaining in negative territory—while the RSI is recovering from sub-30 levels, indicating a potential short-term momentum shift.
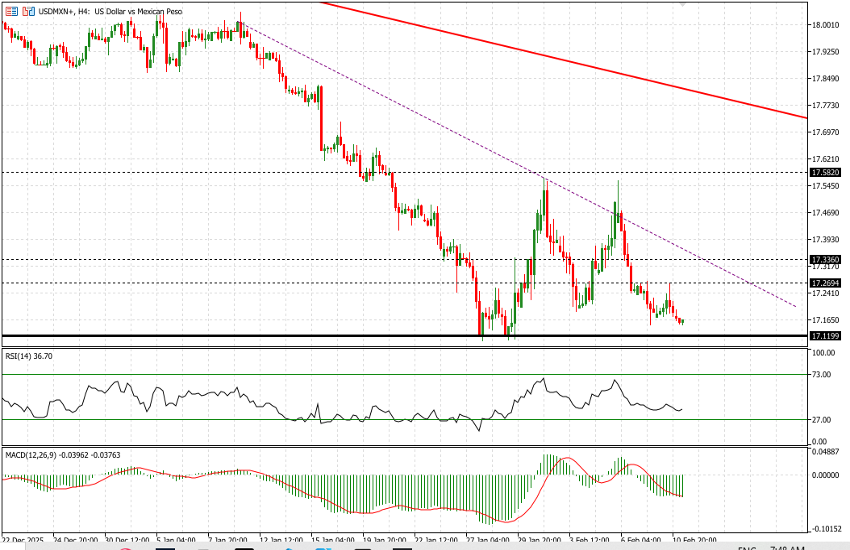
At current levels, a tactical long position may be justified. Initial upside targets are 17.27, followed by 17.335. The descending purple trendline represents an additional resistance barrier, currently positioned around 17.38.
On the downside, a decisive break below 17.12 would likely extend the bearish leg and open the way for further weakness.


