



At one point during yesterday’s highly volatile session, gold and silver were down by 8.45% and 9.84%, respectively, compared to the previous day’s settlement. All of this occurred while the USD was strengthening, and its most traded index—the DXY—was approaching 100, driven by another sharp rise in yields across the entire U.S. curve. The 10-year yield reached 4.445%, with widespread selling (which pushes yields higher) also on the short end, as the 2-year briefly traded above 4%. Meanwhile, oil was rising again, with both Brent and WTI crude above $100.
In short, the typical intermarket relationships were functioning as expected. However, this dynamic was quickly reversed by comments from Trump—later proven inaccurate—regarding contacts with Iranian authorities that were supposedly leading to positive developments aimed at easing tensions in the Persian Gulf. Gold rebounded by $413 within minutes from a low of $4,099, eventually closing slightly lower (by recent standards) at 1.11%. Silver performed better: after hitting a low of $61.01, it ended the day up 2.79%.
There are some positive takeaway from this move, particularly in terms of volumes, which were extremely high. Combined with the magnitude of the price action, this suggests a potential capitulation phase—the final stage of a trend. That said, it is still too early to determine whether a long-term bottom has been established or, more likely, a temporary floor that may hold for a few weeks and still requires retesting.
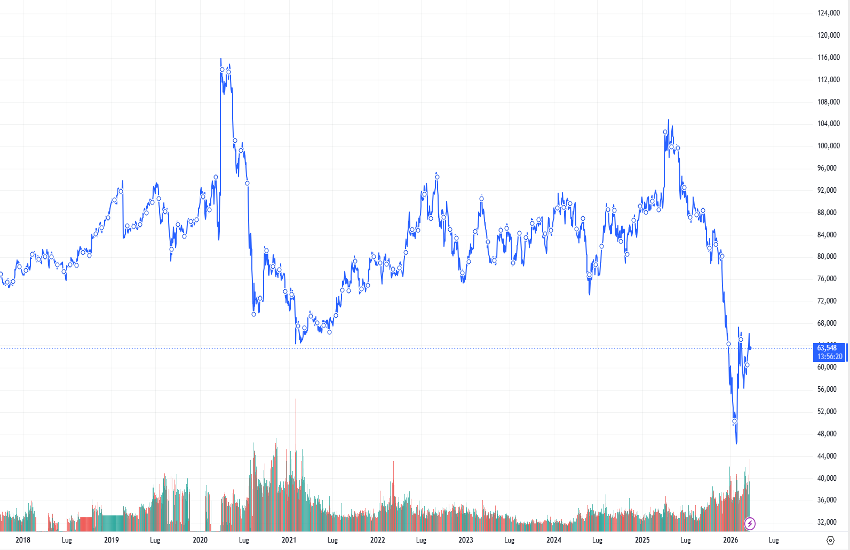
A few months ago, focus was placed on the Gold/Silver ratio, which was trading near historically low levels (around 46). In periods of elevated volatility, trading spreads that exhibit cointegration—such as this ratio or Brent vs. WTI—can be a more effective approach. The expectation was that silver would underperform gold, regardless of direction, given its relative overvaluation. This scenario has materialised: the ratio has risen to 63.79 and may still have some upside potential, although it is now approaching more neutral territory.
That said, attention now shifts to the XAGUSD chart.
TECHNICAL ANALYSIS
Yesterday morning, the price touched $60.973 and formed a classic hammer pattern according to candlestick analysis. The previous low from February 6 was briefly broken intraday but quickly recovered; therefore, $64.10 is considered the key structural floor.
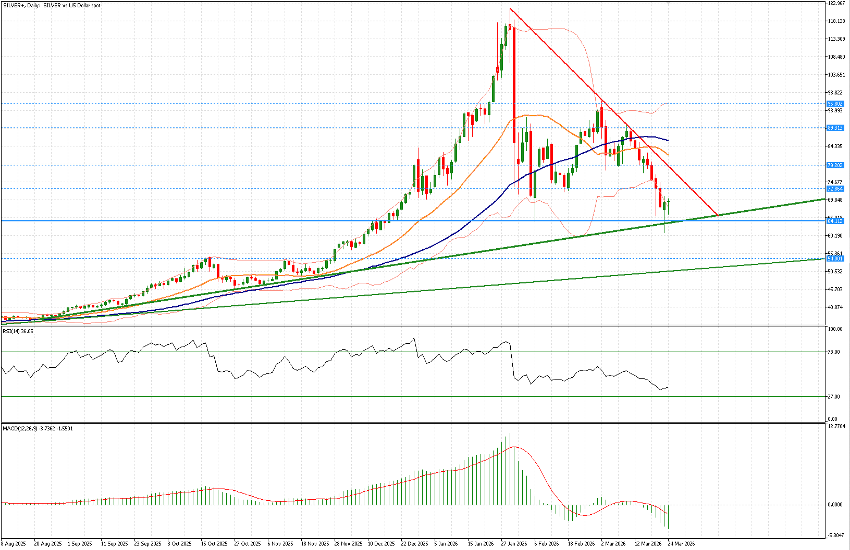
The upward trendline from August 2025 aligns closely with these levels. A longer-term trendline sits lower, currently around $49.70.
Price is now trading back inside the Bollinger Bands, indicating a potential pause or reversal of the March downtrend. Key resistance levels are identified at $72.85 and around $77, where the descending trendline from the January highs near $120 comes into play.
Additional static resistance levels—more relevant over a longer time horizon—are located at $79.20 and $89.30.
Between these levels, the 21-day moving average (currently at $81.83) and the 50-day moving average ($85.50) remain in focus. These averages have crossed bearishly, signalling underlying weakness. Momentum indicators also remain negative, with the RSI at 36.42 and the MACD below zero, consistent with recent price action.
Volatility is expected to remain elevated, with alternating upward and downward sessions. However, some stabilisation around current levels—potentially slightly higher—appears likely over the coming weeks.


