



After three full weeks of military tensions, equity markets have finally pulled back with some consistency, and among the indices, some have even entered what is considered correction territory—a decline of more than 10% from their highs. Today, we’ll take a brief overview of them, trying to understand whether it’s time for a pause in the downward movement.
The S&P 500 has dropped by -6.34% from recent highs; worse performance came from the Nasdaq at -7.89%, while the Dow Jones 30—which had been outperforming during the final months of the AI-driven rally, roughly since November—has come close to a correction, reaching -9.46%.
In Europe and Asia, the situation has been worse: the German DAX is at -10.42%, with similar results for the strong-performing Southern European indices (Ibex -11.18%, FTSE MIB -10.05%) and the French CAC (-10.04%). The Nikkei, which had recently been hitting record highs repeatedly, dropped as much as -13.36% at one point, while the Australian ASX 200 has declined less, despite the return of inflation concerns, at -8.06%.
Are we at key levels? Is it time for a rebound, even if just a dead cat bounce?
From a technical perspective, we can divide the indices into three categories.
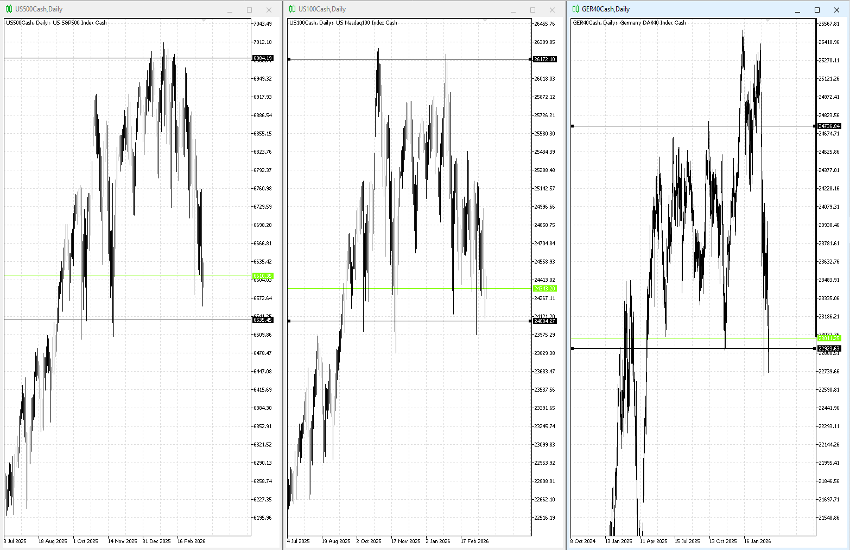
On one side, we have the S&P 500, Nasdaq, and DAX: for months—generally since early summer 2025—they have been trading in a range, albeit a wide one, and are now sitting on very clear and important static support levels: respectively 6550 / 6600, 24300 / 24000, and 22950 / 22700. A break below these areas would likely trigger a rapid extension of the downside move; at the same time, we expect buyers to step in around these levels, at least to try to support prices temporarily.
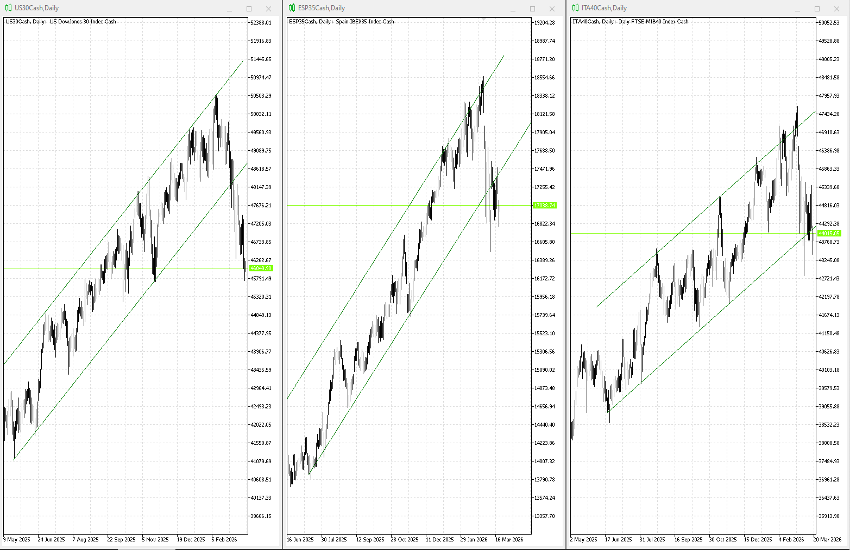
Then we have indices that had performed better in recent months and had not formed a sideways range, instead continuing to move within an upward channel: among these are the US30, ITA40, and ESP35. All of them have now broken their trend—a sign of greater weakness—but are still trading around relevant static levels.
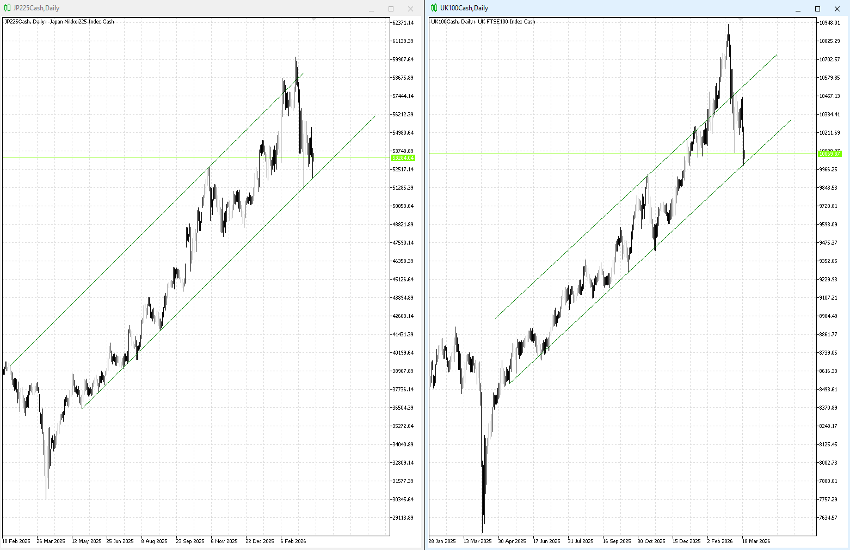
Finally, there are the “exceptions”: the UK100 and JP225, which despite the selling pressure are still trading within their long-term upward channel, currently near its lower boundary.
Today is Friday, typically the day of the week with the highest volumes: we will see whether these technical structures deteriorate decisively, or whether this will be an opportunity to buy at lower prices than those seen in recent months.


