


The GBP/USD pair maintained its bullish recovery on Thursday, October 22, trading around 1.3406 during Asian trading hours. The British Pound has rebounded significantly from its September–October lows, supported by improving technical momentum and expectations that the Bank of England (BoE) could maintain a restrictive monetary policy stance.
However, the pair is now approaching a key technical barrier at 1.3406, corresponding to the 50% Fibonacci retracement level. Although the Relative Strength Index (RSI) and Moving Average Convergence Divergence (MACD) indicators point to strengthening buying momentum, a sustained break above resistance is still needed to confirm the next bullish leg.
Meanwhile, the US Dollar remains influenced by Treasury yields, Fed rate expectations, and geopolitical risks, which could determine GBP/USD’s next move. The British Pound remains supported by expectations of a potential Bank of England (BoE) rate hike in November, following UK inflation’s rise to an 11-month high in September. However, easing inflation or dovish BoE signals could weaken Sterling and limit further gains.
Declining US Treasury yields have pressured the Dollar, supporting GBP/USD. However, markets were pricing in an approximately 90% chance of a December Fed rate hike at the time of the original assessment. Strong US data, rising yields, or escalating Middle East tensions could revive demand for the safe-haven USD and limit the pair’s upside.
Technical Analysis
GBP/USD has rebounded from 1.3137 and is testing resistance at 1.3406, the 50% Fibonacci retracement level. A daily close above this barrier could open the way toward 1.3470–1.3492, followed by 1.3557–1.3569 and 1.3676.On the downside, immediate support lies at 1.3370–1.3380. A break below this zone could expose 1.3330–1.3343, followed by the 1.3264–1.3284 demand zone and deeper support at 1.3177–1.3137.
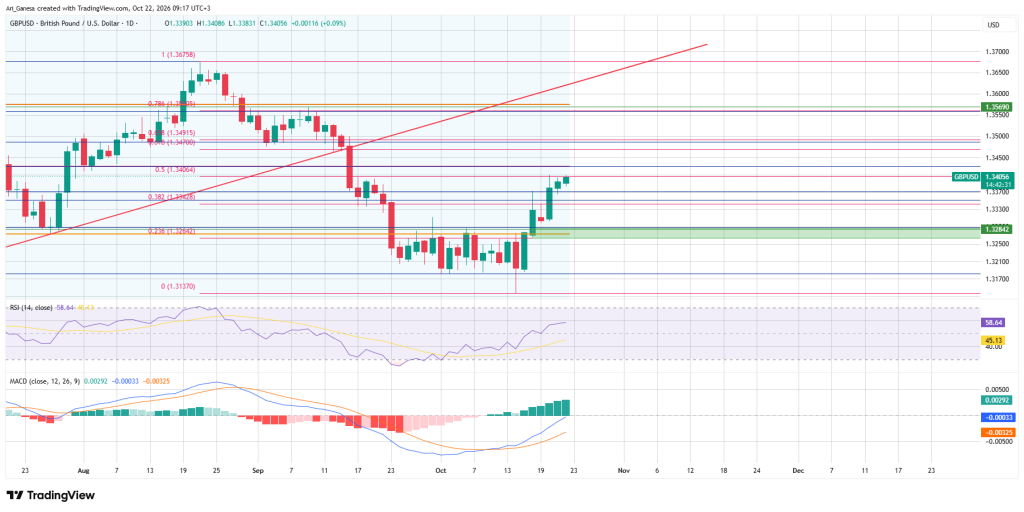
The 14-day RSI stands at 58.64, above the neutral 50 level but below the overbought threshold of 70, indicating strengthening bullish momentum. Meanwhile, the MACD line at -0.00033 is above its signal line at -0.00325, with a positive histogram of 0.00292. These signals support the recovery, although resistance at 1.3406 remains a key hurdle.
A confirmed break above 1.3406 could extend gains toward 1.3470–1.3492. Failure to break resistance may trigger consolidation toward 1.3370–1.3380. A sustained break below this support could expose 1.3330–1.3343 and 1.3264–1.3284. Traders should also monitor UK inflation, Bank of England policy expectations, US economic data, Treasury yields, and geopolitical developments for potential volatility.
Combining Fibonacci levels, RSI, MACD, and fundamental developments helps traders identify potential entry and exit points while managing risk. Appropriate stop-loss placement and position sizing remain essential because technical signals do not guarantee future price movements.